



Looker is the governance-first BI platform built on LookML and Google Cloud, while Tableau is the visualization-first BI platform built on drag-and-drop dashboards and Salesforce integration. Pick Looker when semantic governance and AI accuracy matter most; pick Tableau when visual storytelling, self-service, and lower entry cost matter most.
This looker vs tableau comparison breaks down pricing, features, AI accuracy, and use cases - the same axes that surface in the top side-by-side comparison results for the keyword. Our analysis draws on each vendor’s current documentation, public pricing pages, and independent research firms rather than sponsored placement or hands-on benchmarking we did not perform. AI Productivity may earn a commission from links on this page; rankings are editorially independent.
Quick Verdict (TL;DR)
Looker wins on data governance and AI accuracy, while Tableau wins on visualization quality, ease of use, and total cost. The two platforms target different buyers: a Google Cloud data engineering team versus a Salesforce business analyst team.
Choose Looker if:
- You’re heavily invested in Google Cloud
- Data governance and semantic modeling are priorities
- Your team has SQL/LookML expertise
- You need AI analytics that don’t hallucinate
- Budget exceeds $150 per user/month
Choose Tableau if:
- Visual storytelling is your primary use case
- You want drag-and-drop simplicity
- You’re in the Salesforce ecosystem
- You need flexible pricing from $15-75/user
- Interactive dashboards matter more than governance
The bottom line: Looker is the technical platform for governed analytics; Tableau is the visual platform for business users.
Platform Overview
Looker and Tableau are both enterprise BI platforms, but they originate from opposite ends of the analytics stack - Looker from the semantic-modeling layer and Tableau from the visualization layer. The strengths and tradeoffs below explain the 4 major differences that shape every short-list.
Looker: The Governance-First BI Platform
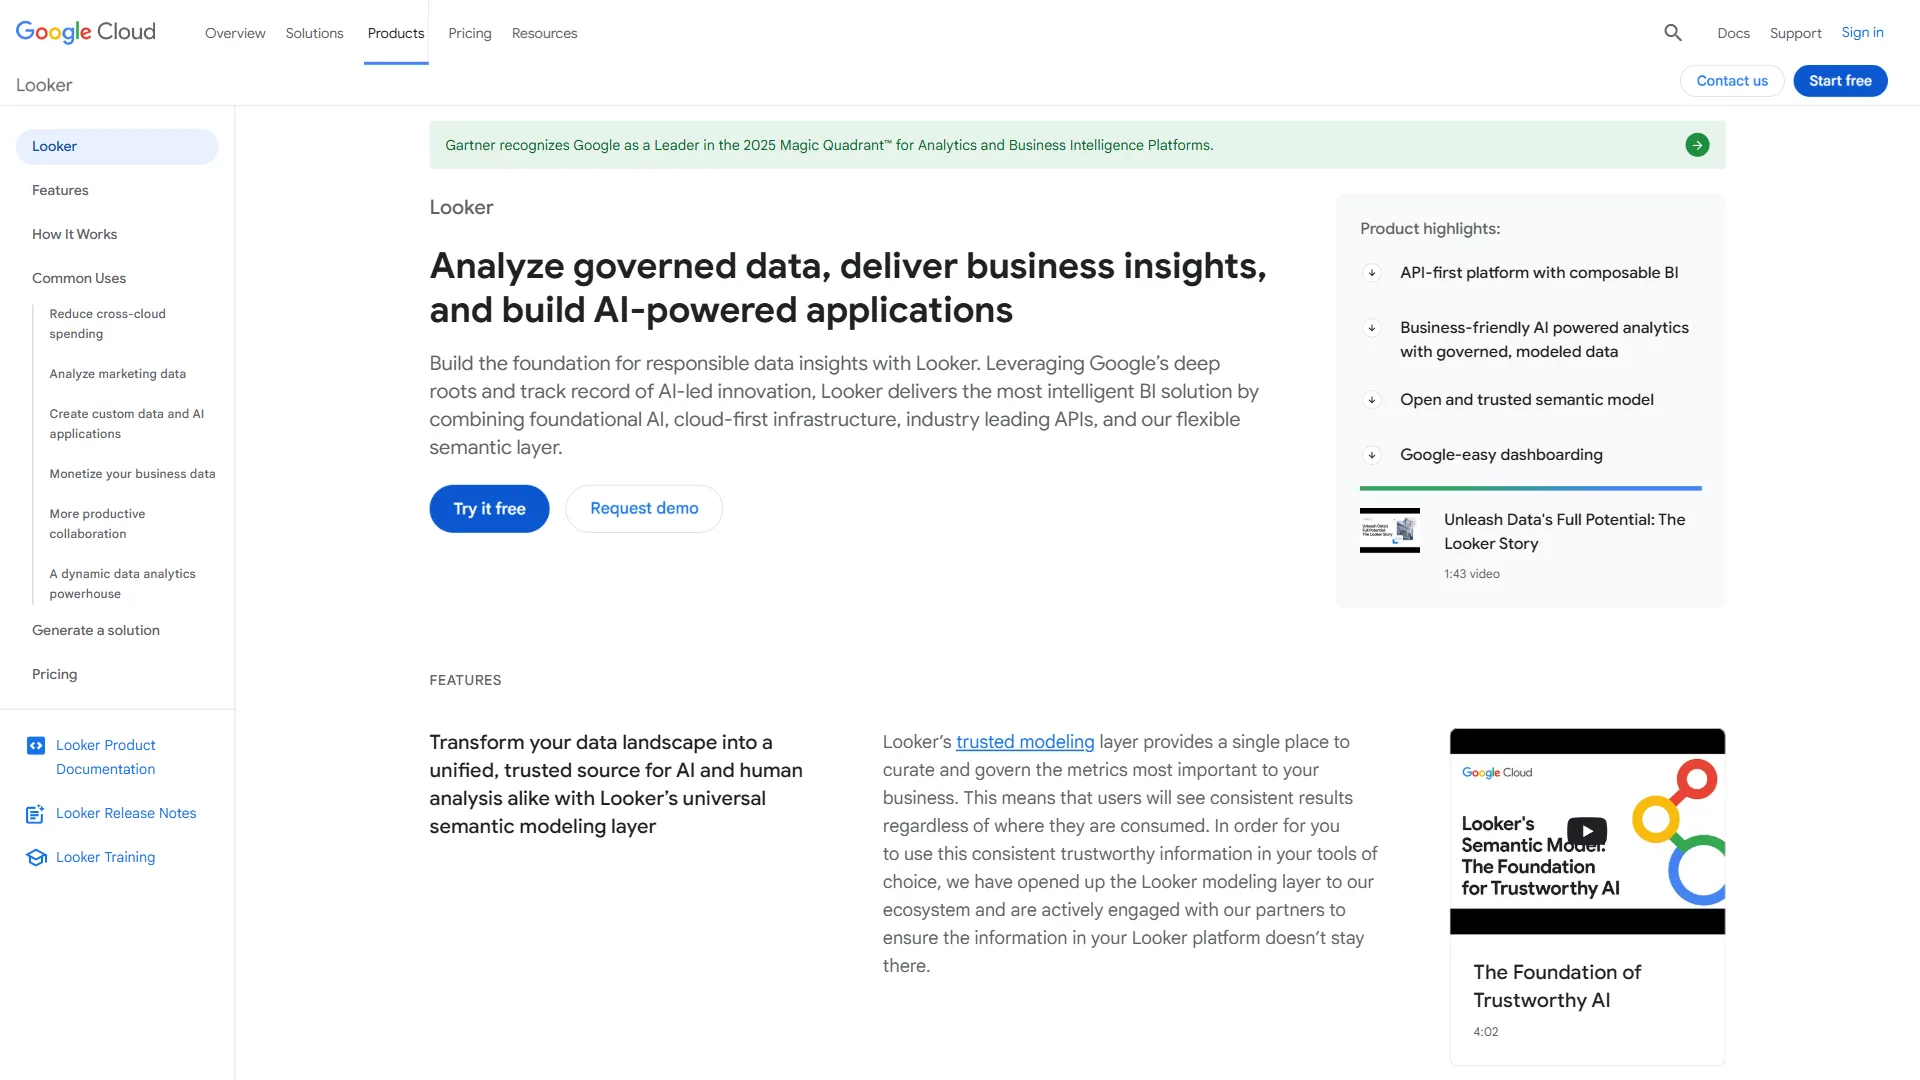
Looker was acquired by Google in 2019 for $2.6 billion and distinguishes itself through LookML - a proprietary modeling language that creates a single source of truth for enterprise data. Unlike traditional BI tools that query databases directly, Looker enforces semantic layers that define metrics consistently across all analyses.
“A semantic layer is essential for accurate AI on enterprise data,” according to Kate Wright, Senior Director of Product Management at Google Cloud, in commentary on Looker’s Gemini integration. When Gemini AI queries your data through Looker’s semantic layer, it references pre-validated business logic rather than raw tables, dramatically reducing hallucination risk.
Key capabilities:
- LookML semantic modeling language
- Native BigQuery integration
- Gemini AI for natural language queries (GA)
- Embedded analytics for white-label deployments
- Git-based version control for data models
Ideal for: Google Cloud-native organizations, technical teams comfortable with SQL, enterprises requiring strict data governance.
Tableau: The Visualization Powerhouse
Tableau is now part of Salesforce’s Einstein 1 platform and built its reputation on best-in-class data visualizations. The drag-and-drop interface lets non-technical users create sophisticated charts, maps, and interactive dashboards without writing code, and the official Tableau Desktop documentation walks through the core analytical patterns.
Tableau has significantly broader market adoption and more extensive user feedback. The platform excels at visual discovery - letting analysts explore data through iterative chart creation rather than pre-defined semantic models.
Key capabilities:
- Industry-leading visualization library
- VizQL visual query language
- Tableau Pulse for AI-driven insights
- Tableau Agent for autonomous analytics
- Deep Salesforce Data Cloud integration
Ideal for: Data storytellers, business analysts without SQL skills, Salesforce customers, teams prioritizing interactive dashboards.
Feature-by-Feature Comparison
Data Visualization
| Capability | Looker | Tableau |
|---|---|---|
| Tool | ||
| Chart Types | 20+ standard types | 50+ chart types + custom |
| Custom Viz | Limited | Extensive (Extensions API) |
| Interactive Filters | Basic | Advanced (parameter actions) |
| Mobile Viz | Good | Excellent |
| Verdict | Functional | Best-in-class |
Winner: Tableau
Tableau’s visualization capabilities are unmatched in the BI space - sankey diagrams, geographic heat maps, animated time-series, and pixel-perfect dashboard design with custom palettes and parameter controls that Looker does not replicate. Looker’s charts are serviceable for operational dashboards and embedded analytics where governance outweighs aesthetic flexibility. Teams comparing more BI options should also see our best BI tools 2026 roundup.
Data Governance and Modeling
| Capability | Looker | Tableau |
|---|---|---|
| Tool | ||
| Semantic Layer | LookML (native) | Logical layer (basic) |
| Version Control | Git integration | Limited |
| Metric Definitions | Single source of truth | Multi-definition risk |
| Data Lineage | Excellent | Good |
| Access Controls | Field-level | Row-level |
| Verdict | Industry-leading | Standard |
Winner: Looker
Looker dramatically outperforms Tableau on governance. LookML defines business metrics once and applies them consistently across every dashboard, API call, and AI query - so “revenue” returns the same calculation everywhere. Tableau’s logical layer offers basic metric consistency but does not enforce it, which becomes disqualifying for healthcare and finance compliance. Looker’s Git integration routes model changes through code review and merge requests, treating analytics code with the same rigor as application code.
AI and Machine Learning
| Feature | Looker | Tableau |
|---|---|---|
| Tool | ||
| Natural Language Queries | Gemini AI (GA) | Tableau Agent |
| AI Maturity | Production-ready | Public preview |
| Semantic Understanding | Excellent (LookML) | Good |
| Autonomous Analytics | Limited | Advanced |
| Error Reduction | 66% fewer AI errors | Standard LLM errors |
| Verdict | Accurate | Capable |
Winner: Looker (for accuracy)
Looker’s Gemini integration cuts AI errors by 66% according to Google’s internal benchmarking, because Gemini references pre-validated LookML metric definitions rather than guessing database columns. For enterprises adopting AI analytics, that accuracy is the trust foundation, and broader patterns are covered in our AI knowledge management tools overview. Tableau Agent (announced at Dreamforce 2023) is more autonomous - it identifies anomalies, generates insights, and recommends dashboards - but without a semantic foundation it occasionally misreads business logic. Pick Looker for AI accuracy, Tableau Agent for AI breadth.
Integrations and Ecosystem
| Integration Type | Looker | Tableau |
|---|---|---|
| Tool | ||
| Native Cloud | Google Cloud | Multi-cloud |
| CRM Integration | Basic | Salesforce (deep) |
| Data Warehouses | 60+ connectors | 100+ connectors |
| Embedded Analytics | Excellent (API-first) | Good |
| Third-party Apps | 50+ via Google Marketplace | 1000+ via Exchange |
| Verdict | Google-focused | Ecosystem leader |
Winner: Tableau
Tableau’s ecosystem is substantially larger - 1,000+ Tableau Exchange extensions versus Looker’s 50+ Google Cloud Marketplace integrations. Google Cloud-native teams still favor Looker for its tight BigQuery, Cloud SQL, and Vertex AI integration, including BigQuery caching and GA4 access. Salesforce customers should note Tableau’s best-in-class Data Cloud, Service Cloud, and Sales Cloud integration through Einstein 1 - data flows Looker cannot replicate without custom API work.
Ease of Use
| Aspect | Looker | Tableau |
|---|---|---|
| Tool | ||
| Interface | Code-first (LookML) | Visual drag-and-drop |
| Learning Curve | Steep (requires SQL) | Moderate |
| Time to First Dashboard | 2-4 weeks | 1-3 days |
| Self-service BI | Limited | Excellent |
| Non-technical Users | Challenging | Accessible |
| Verdict | Technical only | Business-friendly |
Winner: Tableau
Tableau’s drag-and-drop interface is dramatically more accessible than Looker’s code-first LookML approach - business analysts build dashboards in hours instead of weeks. Looker requires SQL plus LookML expertise to extend the semantic layer, which creates governance benefits but also bottlenecks where business users depend on data engineers. For a Tableau-vs-Microsoft framing, our Tableau vs Power BI comparison covers the third major contender.
Pricing Comparison: Looker vs Tableau
Looker costs roughly $150-200 per user each month with enterprise-only contracts, while Tableau ranges from $15-75 per user each month with self-service tiers - a 6-12x difference that drives most looker vs tableau pricing decisions. Total cost of ownership widens further once BigQuery query fees and LookML developer salaries are included.
Looker Pricing
Looker operates on enterprise-only pricing with no self-service tier:
- Standard: $150-200/user/month (estimated)
- Enterprise: Custom pricing (volume discounts available)
- Embedded Analytics: Revenue-based pricing (typically 5-15% of product revenue)
Minimum commitment: 50+ users, annual contract
Hidden costs: Implementation $50,000-200,000; LookML developer salaries $120,000-180,000 per year; pay-per-query BigQuery fees that can exceed Looker licensing.
Cost at scale (500 users): Licensing $900K-1.2M + BigQuery $200K-500K + services $100K-300K = $1.2M-2M per year.
Tableau Pricing
Tableau offers tiered pricing for different user types:
Pricing verified April 2026 from Tableau's pricing page:
- Viewer (Standard): $15/user/mo
- View and interact with dashboards
- Download summary data
- Data-driven alerts and mobile access
- Best for: Stakeholders who consume dashboards but don't build them
- Explorer (Standard): $42/user/mo
- Explore and edit existing workbooks
- Download full data and manage users/content
- Tableau Pulse and Tableau Agent (with Tableau+ subscription)
- Best for: Analysts editing existing dashboards without building from scratch
- Creator (Standard): $75/user/mo
- Create new workbooks and data flows; full Tableau Desktop access
- Tableau Prep Builder for data preparation
- Up to 3 sites; export and curate data sources
- Best for: BI developers building new analytics from raw data
Minimum commitment: 1 Creator license minimum
Hidden costs: Tableau Server self-hosted ($800/core one-time); CRM Analytics adds $75-150/user with Salesforce; Prep Builder included with Creator.
Cost at scale (500 users): 50 Creators $45K + 150 Explorers $75.6K + 300 Viewers $54K = $174,600 per year (86% cheaper than Looker).
Pricing Verdict
Tableau is dramatically cheaper for most use cases - the typical Tableau deployment costs $150-250 per user per year versus Looker’s $150-200 per user per month, a 6-12x difference. Only organizations with specific governance needs or embedded-analytics revenue models justify Looker’s premium.
How Do Looker and Tableau Perform at Scale?
Looker performs better with modern cloud warehouses while Tableau performs better with cached extracts, so the looker vs tableau performance winner depends on data architecture. Looker pushes optimized SQL into BigQuery or Snowflake and scales horizontally via warehouse resources; Tableau caches extracts in its in-memory Data Engine and scales vertically via server resources, with extract refreshes as the main bottleneck for real-time queries on large datasets. The trade-offs mirror those covered in our Databricks vs Snowflake comparison at the warehouse layer, and teams pairing BI with AI workflows should review AI tools for data analysis.
Best Picks by Use Case
Looker is the right pick for embedded analytics, regulated industries, and Google Cloud-native teams; Tableau is the right pick for executive dashboards, Salesforce customers, and self-service BI cultures. The use cases explained below map each scenario to its tradeoffs.
When Looker is the Right Choice
- SaaS product analytics: Looker’s API-first architecture and semantic layer white-label sophisticated analytics without exposing raw data structures.
- Regulated industries: Field-level access controls and single-metric definitions deliver consistent, auditable analytics for SOC 2, HIPAA, and GDPR.
- Google Cloud native: Native BigQuery, Cloud SQL, and GA4 integration eliminates data movement and uses BigQuery’s query optimization automatically.
When Tableau is the Right Choice
- Executive dashboards: Tableau’s design flexibility and chart variety create publication-quality dashboards for board presentations.
- Salesforce customers: Deep Data Cloud and Einstein integration provides pre-built connectors that Looker lacks.
- Self-service BI culture: The drag-and-drop interface democratizes analytics across non-technical teams.
Alternatives to Consider
The strongest looker vs tableau alternatives are Power BI, Domo, and ThoughtSpot - each occupies a different price-and-capability slot in the ultimate 2026 BI shortlist. Consider these when neither Looker nor Tableau matches your budget, cloud stack, or interface preferences.
Power BI
Microsoft’s BI platform offers Tableau-like visualizations with Looker-like governance at $10-20 per user each month - the catch is Microsoft-ecosystem lock-in and AI features that lag both competitors. See our Power BI alternatives roundup for deeper context. Best for: Microsoft 365 customers prioritizing cost.
Domo
Domo combines BI, data integration, and app development in one platform at $83-125 per user each month - more approachable than Looker, more structured than Tableau. Best for: Mid-market teams wanting an all-in-one data platform without building a modern data stack.
ThoughtSpot
ThoughtSpot’s search-based analytics sit between Looker’s semantic modeling and Tableau’s visual exploration, with AI-generated insights that rival Looker’s accuracy without LookML expertise. Best for: Teams prioritizing natural language queries over drag-and-drop charts.
Migration and Implementation
Tableau deploys in 4-8 weeks while Looker requires 12-16 weeks because of LookML modeling. Tableau-to-Looker migrations typically cost $100,000-500,000 and 6-12 months for dashboard rebuilds plus new LookML developer hires; Looker-to-Tableau migrations cost $75,000-300,000 and require rewriting LookML logic as calculated fields and rebuilding any embedded-analytics API integrations. Both paths sacrifice governance or visualization quality during the transition, so the safer move is usually to pick correctly the first time.
For self-taught users, Tableau’s community resources (Tableau Public, active forums, third-party training) are substantially better than Looker’s smaller, acquired-platform community. Teams evaluating data analyst workflows alongside the BI choice should also see our AI tools for data analysts roundup.
Final Verdict: Looker vs Tableau
Tableau is the better default pick for most teams, while Looker is the better pick for Google Cloud-native enterprises that need semantic governance for AI accuracy. The checklists below pick the right BI tool for your business needs in a structured way.
Choose Looker if:
- You score 3+ on this checklist:
- Google Cloud is your primary cloud platform
- Data governance is a top-3 business priority
- You have SQL/LookML expertise in-house
- Budget exceeds $150 per user/month
- You need embedded analytics for customers
- AI accuracy matters more than AI breadth
Choose Tableau if:
- You score 3+ on this checklist:
- Visual storytelling is your primary use case
- You want non-technical users building dashboards
- You use Salesforce as your CRM
- Budget is under $75 per user/month
- Interactive dashboards matter more than semantic modeling
- You need extensive third-party integrations
The tie-breaker question: Would you rather invest in data governance (Looker) or data democratization (Tableau)?
For most organizations, Tableau’s combination of usability, pricing, and ecosystem makes it the safer choice. For Google Cloud-native companies or teams building embedded analytics products, Looker’s semantic approach is genuinely transformative. Choose based on data maturity, technical capabilities, and strategic priorities rather than feature checklists alone.
FAQ
Q: Which is better, Looker or Tableau?
Neither is objectively better - Looker wins on governance, Google Cloud fit, and embedded analytics; Tableau wins on visual storytelling, non-technical users, and Salesforce integration. The tie-breaker is whether the organization prioritizes data governance or data democratization.
Q: What are the disadvantages of Looker?
Looker’s main disadvantages are steep $150-200/user/month pricing, a 12-16 week implementation timeline, and a code-first LookML interface that requires SQL expertise. Business users cannot self-serve without data-engineer support, and total 500-user annual cost can reach $1.2-2 million with BigQuery and services.
Q: How does Looker pricing compare to Tableau?
Tableau is dramatically more affordable - $15-75 per user each month versus Looker’s $150-200 per user each month with enterprise-only contracts. A 500-person organization pays roughly $174,600 per year for Tableau versus $1.2-2 million for Looker, an 86% cost difference.
Q: How long does it take to implement Looker vs Tableau?
Tableau deploys in 4-8 weeks with first-week dashboards, while Looker requires 12-16 weeks with weeks 3-6 dedicated to LookML modeling. Looker needs a full-time LookML developer; Tableau needs only a part-time developer and IT admin.
Q: Which BI tool is better for AI analytics accuracy?
Looker leads on AI accuracy. Its LookML semantic layer reduces AI errors by 66% according to Google’s internal benchmarking, because Gemini AI references pre-validated business logic rather than raw tables. Tableau Agent offers more autonomous features but lacks this semantic foundation, which can lead to occasional misinterpretation of business metrics.
Related Reads
Related Reads cover the four tools compared above plus three broader BI roundups for further context.
- Looker - Google Cloud BI platform
- Tableau - Visual analytics platform
- Salesforce - CRM and business platform
- ThoughtSpot - AI-powered search and analytics platform
More data and analytics guides:
- Best AI Research Tools 2026 - Research and analysis tools
- Best AI Automation Tools 2026 - Automation platforms
- Best BI Tools 2026 - Business intelligence platforms
External Resources
External Resources point to vendor documentation, community archives, and Gartner’s BI glossary for primary-source verification beyond this comparison. Cross-checking these sources is the fastest way to validate any claim above.