



The tableau vs power bi debate has been running for years, and in 2026 the answer is more nuanced than ever. Both platforms have added AI assistants, both connect to hundreds of data sources, and both dominate Gartner’s Magic Quadrant. So which one actually deserves your budget?
After comparing pricing, features, AI capabilities, and thousands of independent user reviews, a clear pattern emerges: Power BI wins on value and Microsoft integration, while Tableau wins on visualization depth and design flexibility. The right choice depends on your ecosystem and priorities. For data analysts evaluating their toolkit, this comparison covers the two platforms that show up in nearly every shortlist.
Quick Verdict
Power BI is the better value at $14 per user/month with Microsoft 365 integration, while Tableau is the stronger choice at $75 per user/month for visualization depth and Salesforce ecosystems. This comparison covers pricing, features, and real workflow performance to help you pick the right option for your needs.
Choose Tableau if:
- Visual storytelling and dashboard design are top priorities
- You need advanced calculated fields and analytical depth
- You are in the Salesforce ecosystem
- Your team includes dedicated data analysts or BI professionals
- You can budget $75 per user/month for creators
Choose Power BI if:
- You run Microsoft 365 across your organization
- Budget is a primary concern ($14 per user/month for Pro)
- You want a free tier for individual analysts
- Excel is already your team’s default data tool
- You need Teams and SharePoint embedding
The short version: Power BI delivers 80% of enterprise BI at 20% of Tableau’s price. Tableau delivers the other 20% - and for some teams, that gap matters enormously.
Platform Overview
Tableau (Salesforce)
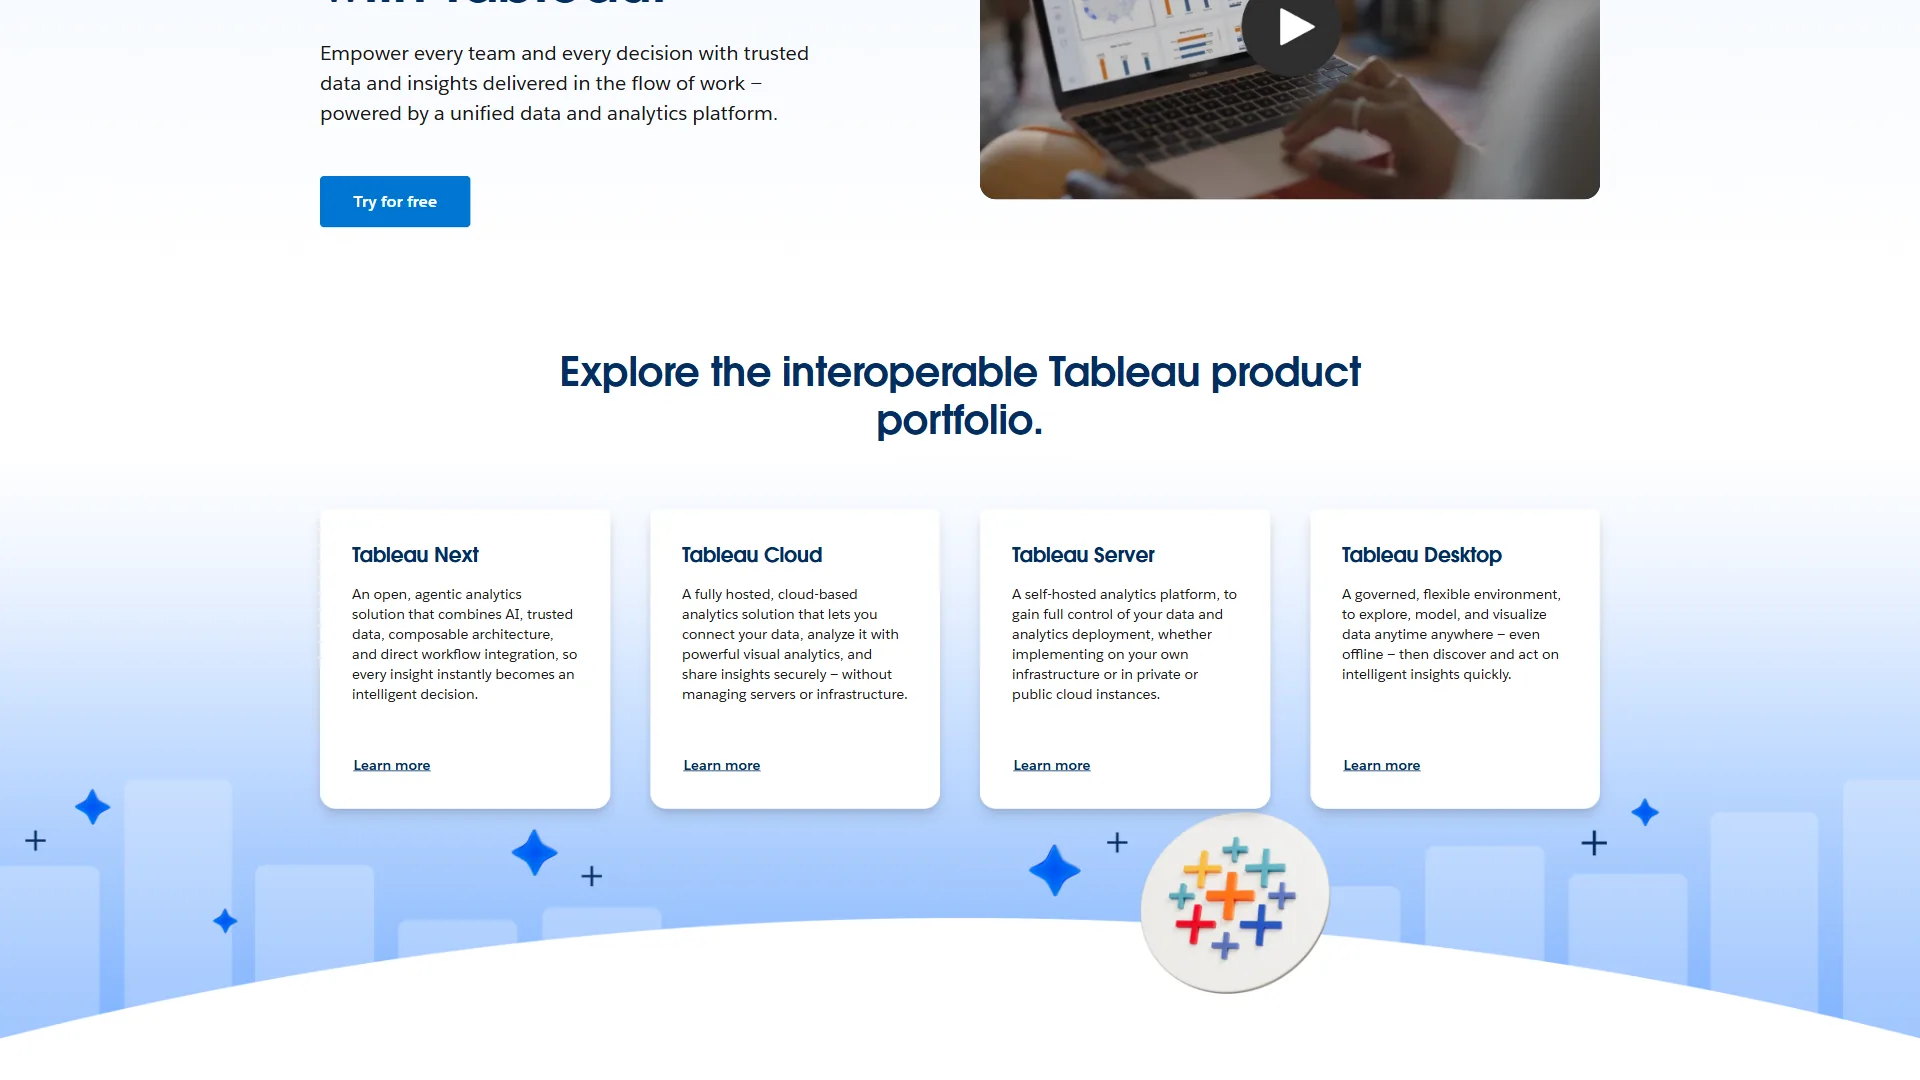
Tableau was founded in 2003 and acquired by Salesforce in 2019. It built its reputation on best-in-class data visualization - the kind of interactive, polished dashboards that make executives sit up and pay attention. The drag-and-drop interface is approachable for visual tasks, though the data modeling layer is not always easier to learn than competing platforms.
In 2026, Tableau has expanded into AI with Tableau Agent (formerly Einstein Copilot) for natural language queries and Tableau Pulse for proactive alerts. Its sustained market share in enterprise BI reflects continued demand from organizations that prioritize visualization quality. The platform connects to 100+ data sources and offers a drag-and-drop interface with over 100 chart types.
Pricing tiers:
- Viewer: $15 per user/month (view only)
- Explorer: $42 per user/month (edit existing content)
- Creator: $75 per user/month (full authoring)
- Enterprise tiers available at $35-$115 per user/month with advanced governance
Best for: Enterprise data visualization teams, Salesforce customers, and organizations with dedicated BI professionals who need sophisticated visual analytics.
Limitations and who it’s not for: Skip Tableau if budget is tight, your stack is Microsoft-first, or you want a free tier - drawbacks include $75 per user/month for Creator licensing and a steeper advanced learning curve (LOD expressions, calculated fields). Cons also include weaker out-of-the-box Microsoft 365 integration compared to Power BI. Not ideal for teams without dedicated BI professionals.
Power BI (Microsoft)
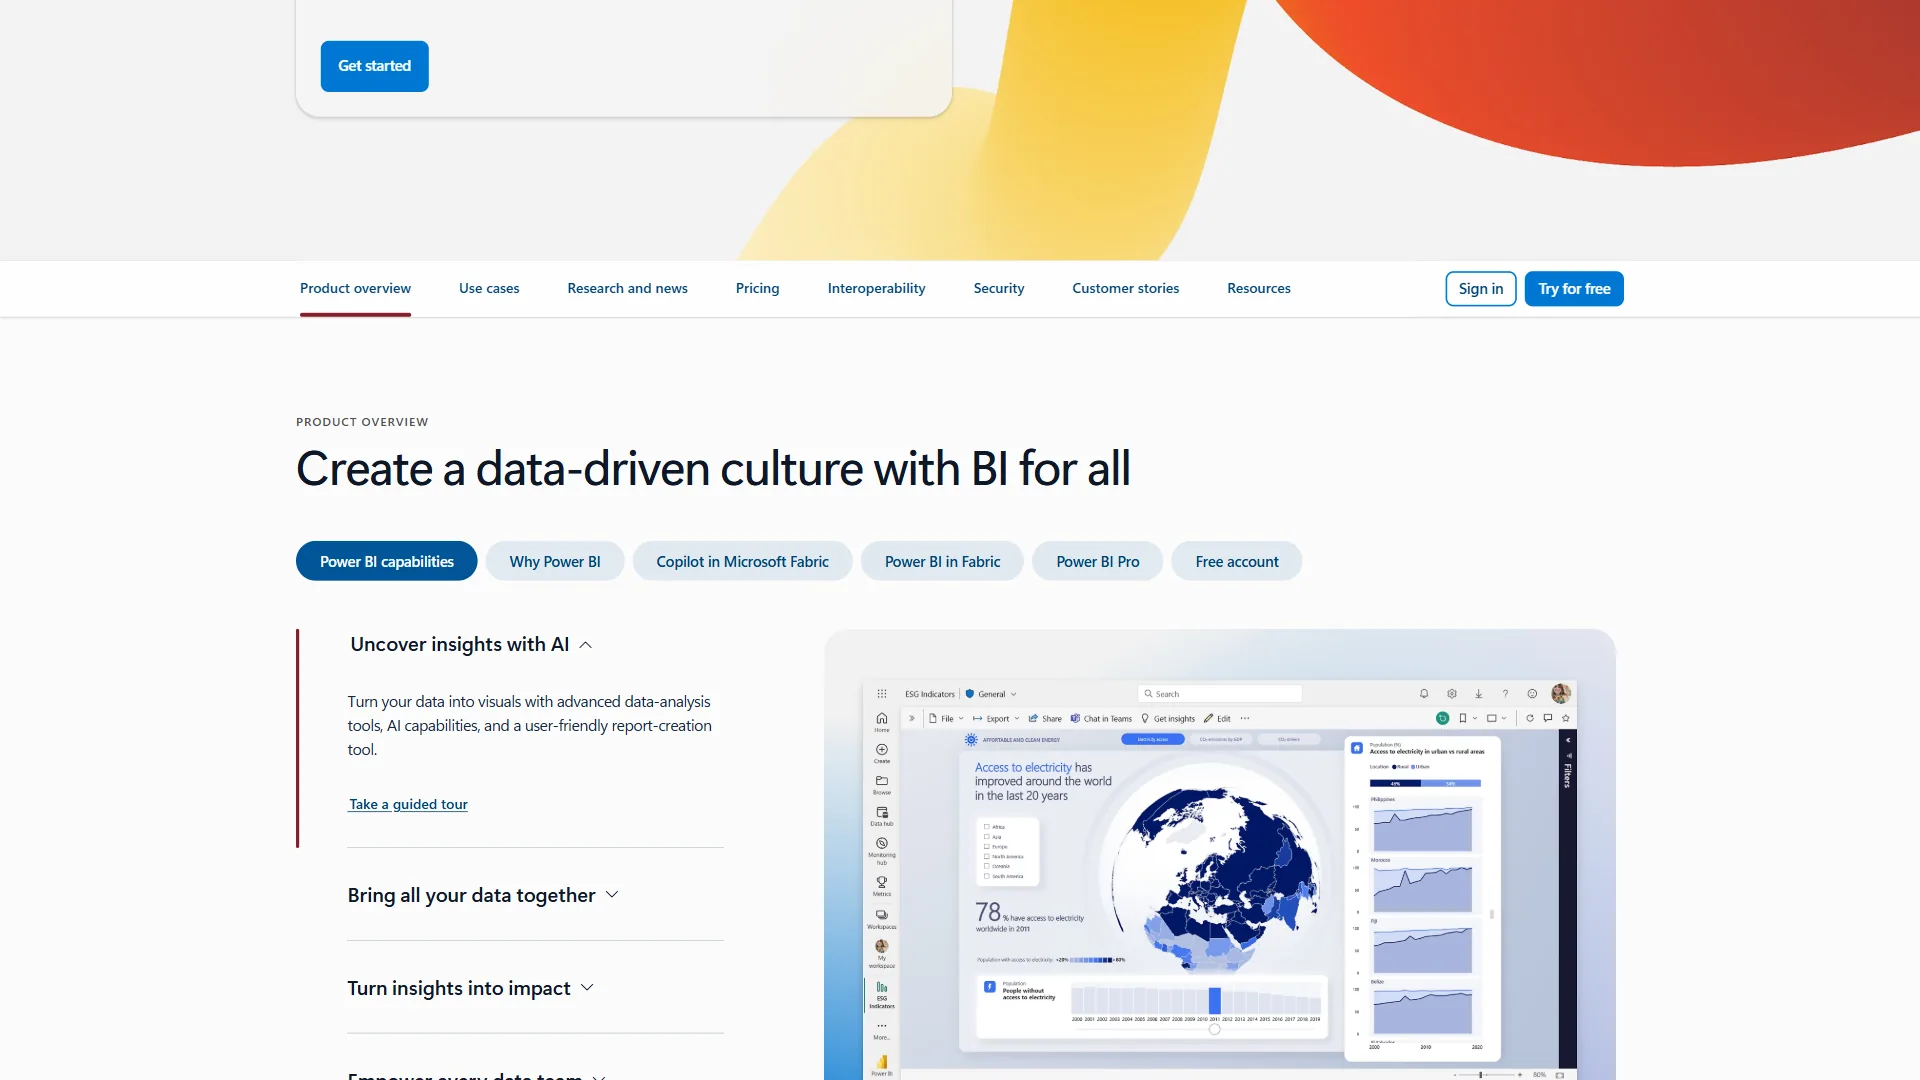
Power BI launched in 2015 as Microsoft’s answer to the BI market, and it has rapidly become one of the most widely adopted analytics platforms in the world with over 5 million users. Its killer advantage is seamless integration with the Microsoft 365 stack - Excel, Teams, SharePoint, and Azure.
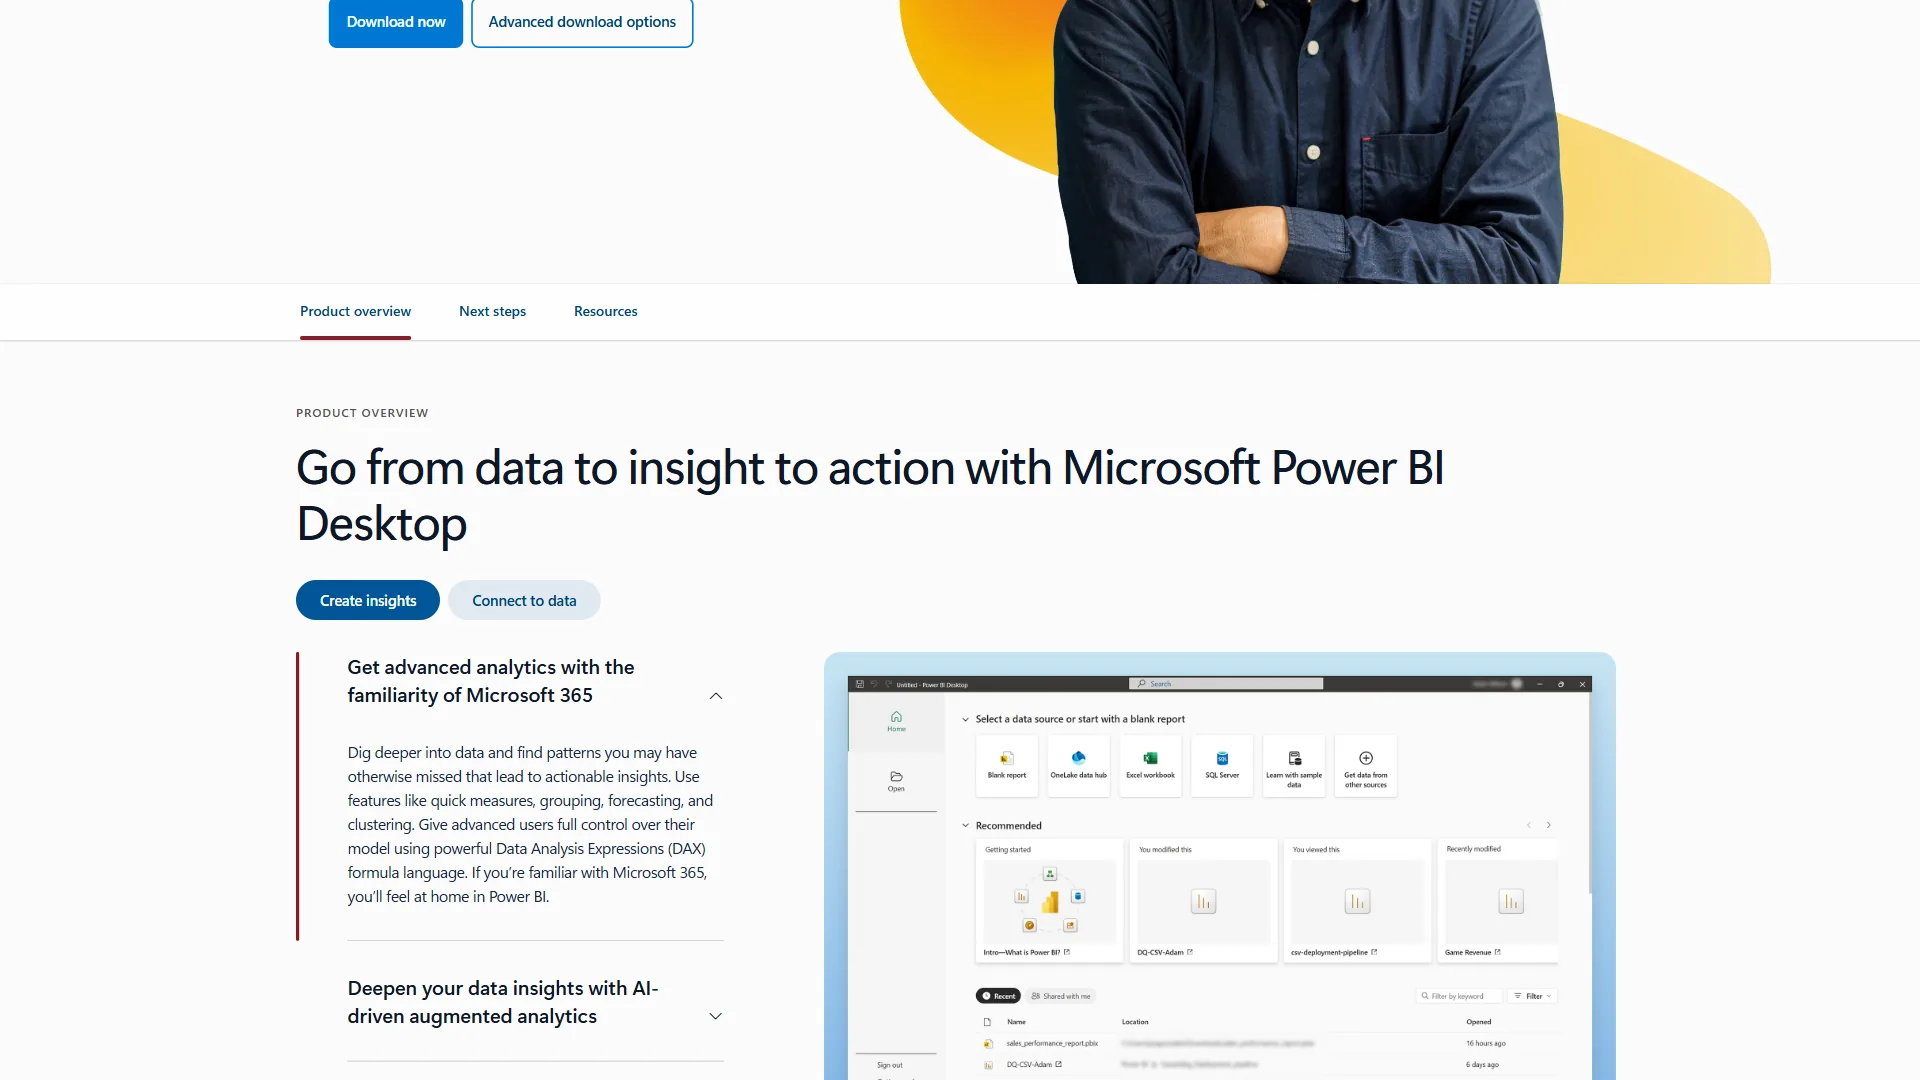
Power BI’s free tier lets individual analysts create unlimited reports with Power BI Desktop. The Pro tier at $14 per user/month enables team collaboration, while Premium Per User at $24 per month unlocks advanced features. Copilot in Power BI is available on Fabric F64+ or Premium P1+ capacity for enterprise customers.
Pricing tiers:
- Free: Personal analytics with Power BI Desktop
- Pro: $14 per user/month (team sharing, 8 daily refreshes)
- Premium Per User: $24 per user/month (advanced analytics, 48 daily refreshes)
- Premium Per Capacity: Custom enterprise pricing (unlimited users)
Best for: Microsoft 365 organizations, budget-conscious teams, and business users who want self-service analytics without a steep learning curve.
Limitations and who it’s not for: Skip Power BI if visualization polish is your top priority, you’re a Salesforce-first shop, or you need pixel-perfect dashboard control - drawbacks include 30+ chart types versus Tableau’s 100+, and cons in design flexibility for executive-facing or public-facing presentations. The best AI features (Copilot) gate behind Fabric F64+ or Premium P1+ capacity, which is a significant enterprise-only cost.
Feature-by-Feature: Tableau vs Power BI
Tableau and Power BI differ most on four dimensions: pricing (5x gap), visualization depth (100+ versus 30+ native chart types), ecosystem fit (Salesforce versus Microsoft 365), and AI gating tier. The sub-sections below break each dimension down with side-by-side specs.
How Do Tableau and Power BI Compare on Pricing?
| Aspect | Tableau | Power BI |
|---|---|---|
| Tool | ||
| Free tier | Tableau Public only (public data) | Yes (personal use, unlimited reports) |
| Entry price | $15/user/month (view only) | $14/user/month (full collaboration) |
| Full authoring | $75/user/month (Creator) | $14/user/month (Pro) |
| Advanced features | $115/user/month (Enterprise Creator) | $24/user/month (Premium Per User) |
| Enterprise capacity | Custom | Custom |
Winner: Power BI
Power BI costs roughly five times less than Tableau for equivalent authoring capabilities, at $14 per user/month versus $75 per user/month. Power BI Pro at $14 per month gives you full report authoring, team sharing, and 100+ data connectors, while Tableau’s equivalent Creator license costs $75 per month.
For a 100-person team with 20 creators, 30 explorers, and 50 viewers, Tableau runs roughly $46,000/year versus Power BI’s $16,800/year on Pro licenses.
Power BI’s free tier sweetens the deal further: individual analysts can build unlimited dashboards in Power BI Desktop for free, while Tableau only offers Tableau Public, which requires making data publicly visible. See our Domo vs Power BI comparison for another budget-friendly contender.
Data Visualization
| Capability | Tableau | Power BI |
|---|---|---|
| Chart types | 100+ built-in | 30+ built-in |
| Custom visuals | Extensions API | 1,000+ marketplace visuals |
| Design flexibility | Pixel-perfect control | Template-based |
| Interactive filters | Advanced parameter actions | Standard cross-filtering |
| Data storytelling | 5/5 | 3.5/5 |
Winner: Tableau
Tableau’s visualization engine remains the industry benchmark. The drag-and-drop interface supports 100+ chart types with pixel-perfect control over colors, typography, layout, and interactivity - including Sankey diagrams, geographic heat maps, and animated time-series plots natively.
Power BI’s visualizations are adequate for standard business reporting, and its marketplace offers 1,000+ custom visuals. But when you need polished executive presentations or data-journalism-quality graphics, Tableau’s design flexibility pulls ahead. If your primary use case is operational dashboards, Power BI is sufficient; for board, client, or public presentations, Tableau’s visual polish justifies its premium.
Microsoft and Salesforce Ecosystem Integration
| Integration | Tableau | Power BI |
|---|---|---|
| Excel | Good (import/export) | Native (bidirectional) |
| Teams | Basic embedding | Native embedding and tabs |
| SharePoint | Limited | Full integration |
| Azure | Connectors available | Native (Azure Synapse, Data Factory) |
| Salesforce | Deep native integration | Connector available |
| Google Cloud | Connectors available | Connectors available |
Winner: Depends on your stack
The tableau vs power bi decision often gets settled here before features enter the picture. If your company runs on Microsoft 365, Power BI slots into your existing workflow: reports embed directly into Teams channels, Excel data flows into dashboards, and SharePoint acts as a natural distribution layer.
Tableau, on the other hand, offers deep Salesforce integration that Power BI cannot match. If your CRM is Salesforce, Tableau provides pre-built connectors to Sales Cloud, Service Cloud, and Data Cloud with Einstein AI features layered on top. See our best CRM tools 2026 roundup for Salesforce-aligned analytics. For organizations not locked into either ecosystem, Power BI’s Microsoft integration is the more universal advantage given Microsoft 365’s broader enterprise adoption.
AI Features
| AI Capability | Tableau | Power BI |
|---|---|---|
| Tool | ||
| AI assistant | Tableau Agent | Copilot |
| Natural language queries | Ask Data | Q&A + Copilot |
| Proactive insights | Tableau Pulse | Smart Narratives |
| Predictive analytics | Einstein Discovery | Forecasting + anomaly detection |
| Availability | With Tableau+ subscription | Copilot requires Fabric F64+ |
Winner: Tie (with caveats)
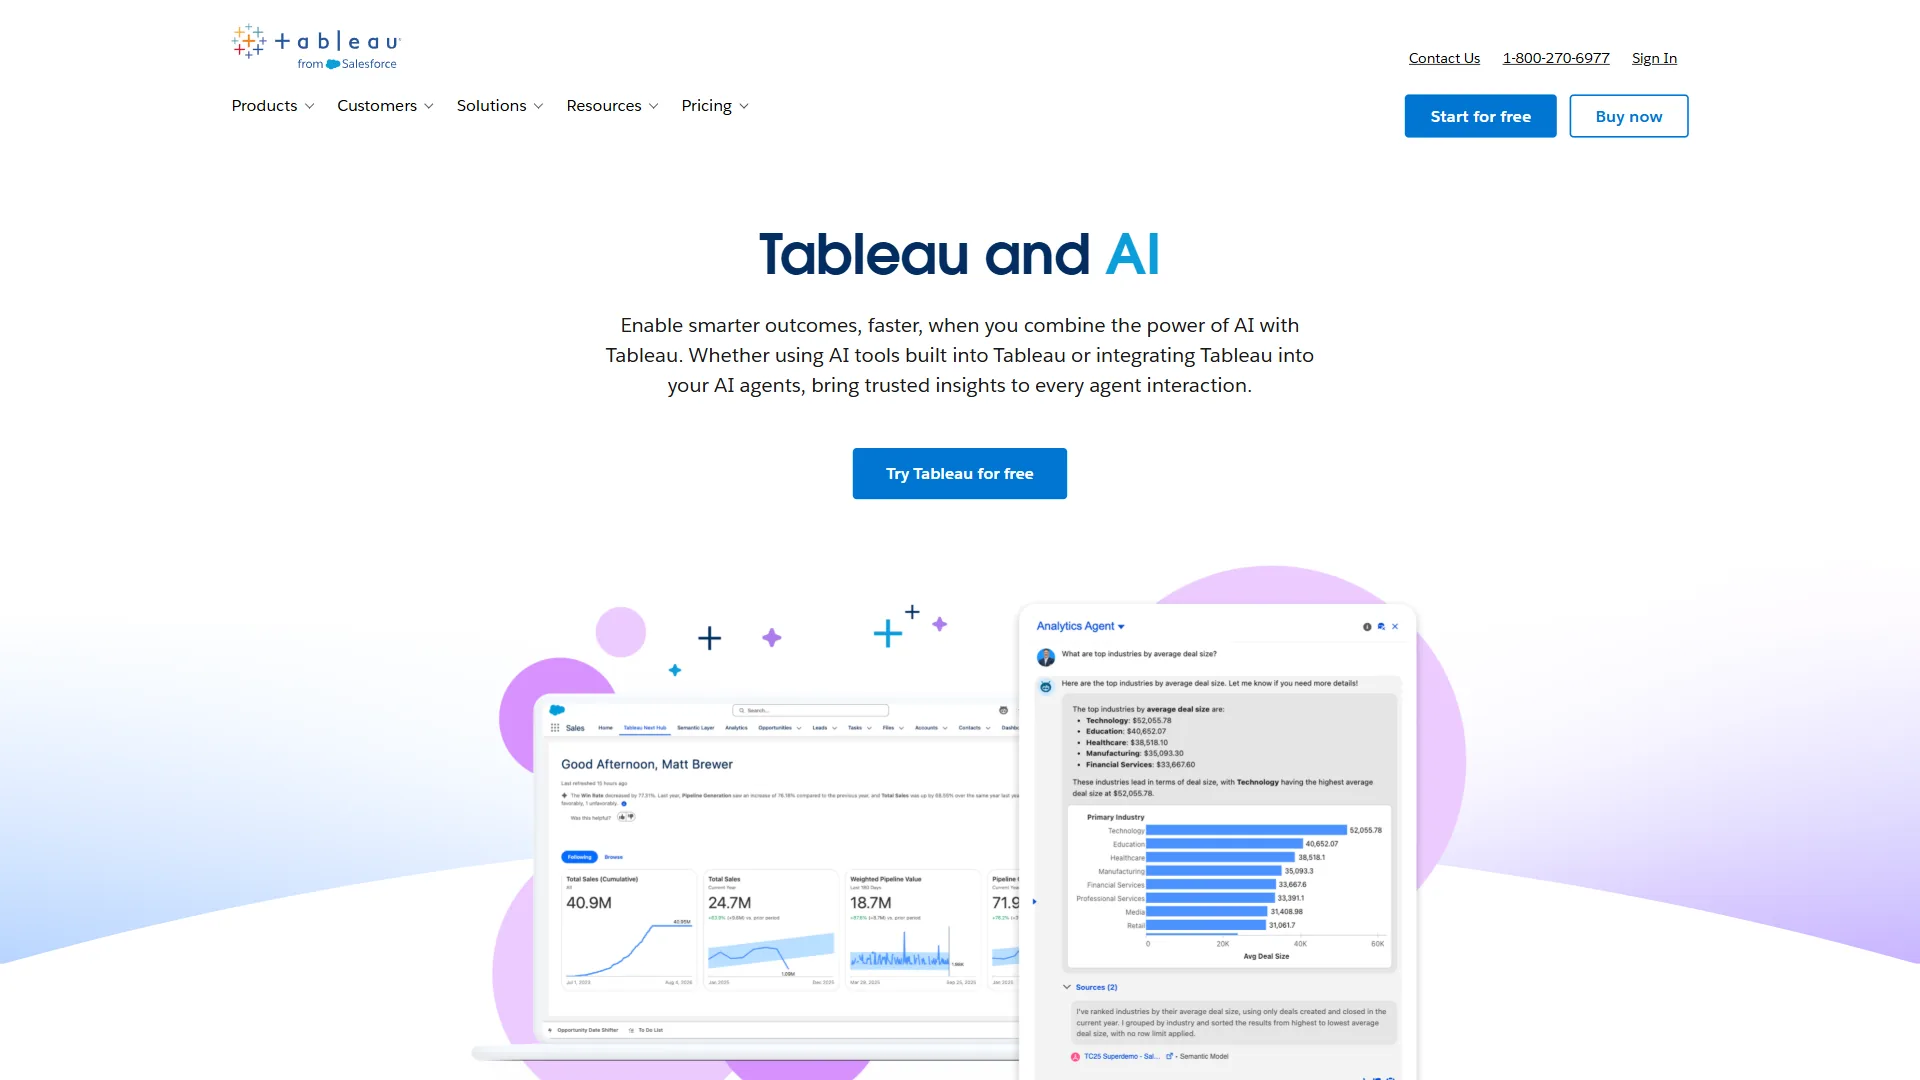
Both platforms have invested heavily in AI for 2026, but both gate their best AI features behind premium tiers.
Tableau Agent enables natural language queries, automated data prep, and dashboard narratives - but only with a Tableau+ subscription on top of existing licensing. Tableau Pulse delivers proactive metric-change alerts useful for executives.
Power BI Copilot generates reports from plain English, writes DAX queries, and creates narrative summaries - but only on Fabric F64+ or Premium P1+ capacity, an enterprise-level investment. Pro and PPU users get Q&A and Smart Narratives, not the full Copilot experience. The marketing from both vendors oversells AI accessibility, so budget carefully if AI features are a deciding factor.
Which Is Harder to Learn: Tableau or Power BI?
| Aspect | Tableau | Power BI |
|---|---|---|
| Interface style | Visual drag-and-drop | Visual drag-and-drop (Excel-like) |
| Time to first dashboard | 1-3 days | 1-2 days |
| Advanced learning curve | Steep (calculated fields, LOD) | Steep (DAX formulas) |
| Excel user transition | Moderate adjustment | Minimal adjustment |
| Training investment | 40-80 hours for proficiency | 20-40 hours for proficiency |
Winner: Power BI (slight edge)
Both tools use drag-and-drop interfaces, but Power BI feels more familiar to Excel users - which describes most business professionals. The ribbon interface, cell references, and data modeling concepts translate naturally from spreadsheet workflows.
Tableau’s basic interface is intuitive, but advanced features like Level of Detail (LOD) expressions have a steeper ramp. Power BI’s equivalent DAX formulas are also challenging, but the broader Excel user community means more tutorials and support resources exist. For organizations with non-technical users who need self-service analytics, Power BI’s Excel-adjacent experience lowers the adoption barrier.
Choose Tableau or Power BI if
Choose Tableau if visualization quality, Salesforce integration, or dedicated BI staff matter most, and choose Power BI if Microsoft 365 fit, a free starting tier, or budget under $20 per user/month matter most. The two checklists below break down the decision triggers for each platform.
Choose Tableau When
You prioritize visualization quality. If your dashboards serve executive presentations, client reports, or public-facing analytics, Tableau’s design flexibility is worth the premium.
You are a Salesforce customer. The native Salesforce integration creates a unified analytics experience Power BI cannot replicate, and Tableau Agent with Einstein Discovery provides CRM-specific AI insights.
You have dedicated BI professionals. Tableau rewards expertise: teams who can leverage calculated fields, parameters, and dashboard actions extract significantly more value than casual users.
You need advanced visual analytics. Geographic mapping, statistical modeling, and trend analysis with custom calculations push beyond standard reporting and play to Tableau’s strengths.
Choose Power BI When
You run Microsoft 365. The integration advantage is decisive: embedding reports in Teams, syncing with SharePoint, and connecting to Azure Synapse happens natively without custom development.
Budget matters. At $14 per month for Pro versus $75 per month for Tableau Creator, cost savings compound rapidly across organizations.
Your team lives in Excel. Power BI’s data modeling and interface feel like a natural extension of Excel workflows, and analysts comfortable with pivot tables and formulas adapt quickly.
You want a free starting point. Power BI Desktop is free for personal analytics, letting teams prototype before upgrading to Pro. Our guide on how to create reports with AI covers techniques that work across both platforms.
Alternatives Worth Considering: Limitations
The strongest alternatives to Tableau and Power BI are Looker for Google Cloud-native semantic governance and Qlik Sense for associative analytics across 40M+ records. Skip Tableau or Power BI if you need LookML-style centralized governance or a more flexible associative engine, and consider the two BI tools below instead.
Looker (Google Cloud)
Best for Google Cloud-native organizations that prioritize data governance through its LookML semantic layer. Looker reduces AI data errors by 66% through centralized governance, but requires SQL expertise and enterprise-level budgets ($150-200/user/month). Read our Looker vs Tableau comparison for the full breakdown.
Qlik Sense
Best for complex data exploration with its unique associative analytics engine that handles 40M+ records efficiently. Starting at $30 per user/month, Qlik Sense sits between Power BI and Tableau on price while offering multi-cloud deployment flexibility across AWS, Google Cloud, and Azure. See the best BI tools 2026 roundup for a wider sweep.
The Bottom Line
Power BI is the right default choice for most organizations and Tableau is the right choice when visualization quality justifies a 5x license premium. The tableau vs power bi decision in 2026 comes down to two questions: What ecosystem does your organization run on, and how much does visualization design matter to your use case?
How we compared: This analysis draws on current vendor pricing pages, official Microsoft and Tableau product documentation, and aggregated independent user reviews rather than sponsored placement. AI Productivity may earn a commission from links on this page; rankings and recommendations are editorially independent.
Power BI is the right default choice for most organizations. The combination of Microsoft 365 integration, aggressive pricing ($14 per user/month), a genuine free tier, and solid visualization capabilities makes it the pragmatic pick. According to a commissioned 2024 Forrester Total Economic Impact study, “a composite organization based on interviewed customers experienced benefits of $25.6 million over three years versus costs of $5.5 million, adding up to a net present value of $20.1 million and an ROI of 366%.”
Tableau is the right choice when visual excellence justifies the investment. For enterprise data teams that need publication-quality dashboards, Salesforce ecosystem integration, and the deepest visualization toolkit available, Tableau’s premium pricing delivers premium results. A Forrester Total Economic Impact study documented 127% ROI with $1.9 million in efficiency gains over three years.
Neither platform is objectively better: Power BI wins on value and accessibility, Tableau on visualization depth and design control. Choose based on your stack, budget, and whether your dashboards need to be functional or beautiful.
FAQ
The most common Tableau vs Power BI questions cover the core feature differences, the relative learning curve, and how closely Power BI overlaps with Excel. The short answers are below.
Q: What is the main difference between Tableau and Power BI?
The main difference between Tableau and Power BI is their core strength and pricing. Tableau wins on visualization depth and design flexibility, with pixel-perfect dashboards and 100+ chart types at $75 per user/month for creators. Power BI wins on value and Microsoft 365 integration, offering full report authoring at $14 per user/month. The right choice depends on your ecosystem and how much visual polish matters to your use case.
Q: Which is harder to learn, Power BI or Tableau?
The short version: Power BI delivers 80% of enterprise BI at 20% of Tableau’s price. Tableau delivers the other 20% - and for some teams, that gap matters enormously.
Q: Is Power BI just fancy Excel?
Your team lives in Excel. Power BI’s data modeling and interface feel like a natural extension of Excel workflows. Analysts already comfortable with pivot tables and formulas adapt quickly.
Related Reading
Related reading on Tableau, Power BI, and adjacent BI platforms is grouped below by tool pages and deeper comparison guides.
Tools covered in this article:
- Tableau - Enterprise visual analytics platform
- Power BI - Microsoft AI analytics platform
- Looker - Google Cloud BI platform
- Qlik Sense - Associative analytics platform
More analytics and BI content:
- Looker vs Tableau: Detailed Comparison - Deep dive into Looker and Tableau differences
- Best BI Tools 2026: Complete Buyer’s Guide - Comprehensive comparison including Tableau, Power BI, Looker, and Qlik
- Best AI Analytics Platforms Comparison - How AI analytics platforms compare for enterprise decision intelligence
External Resources
External resources for Tableau and Power BI are the official vendor learning portals linked below.