




The best BI tools in 2026 are Power BI for Microsoft-budget shops, Tableau for visualizations, Looker for governed enterprise metrics, Domo for all-in-one no-code analytics, and Qlik Sense for associative exploration. Each platform now embeds AI natural language queries and automated insight detection, so the right pick depends on budget, team size, and existing data stack.
Our analysis draws on vendor documentation and independent industry research, including the Gartner Magic Quadrant for Analytics and BI Platforms and recent BI tool comparisons ranked by real users. Some links on this page are affiliate links; our analysis remains independent.
Comparison Table: Top BI Tools 2026
The Best BI Tools 2026 include Power BI, Tableau, Looker, Domo and Qlik Sense. Each tool takes a different approach to BI, and the right choice depends on your budget, team size, and the specific workflows you need to optimize.
| Tool | Starting Price | Rating | Best For |
|---|---|---|---|
| Power BI | Free-$24/mo | Budget-friendly Microsoft integration | |
| Tableau | $15/mo | Best-in-class visualizations | |
| Looker | $36K/yr | Enterprise governance + Google Cloud | |
| Domo | $20K/yr | 1,000+ connectors, no SQL required | |
| Qlik Sense | $30/mo | Complex data exploration at scale |
Selection Criteria: What Makes a Great BI Tool in 2026
A great BI tool in 2026 delivers four things: working AI features (not buzzwords), transparent pricing, sub-minute real-time refresh, and governed self-service that prevents metric chaos.
AI capabilities that actually work. Natural language queries that understand context, automated insight discovery, and predictive analytics non-data scientists can configure.
Pricing transparency. Enterprise BI has historically had opaque pricing that varied wildly by negotiation. The best platforms now publish clear tiers, even at the enterprise level.
Real-time data refresh. Winning platforms offer live connections with sub-minute refresh, not overnight batch updates. According to a study by McKinsey, high-performing organizations are roughly twice as likely to embed analytics directly into operational workflows.
Self-service without chaos. Business users need to create their own reports without IT involvement, with guardrails so the same metric does not have 50 conflicting definitions.
1. Power BI: Best Budget-Friendly Option
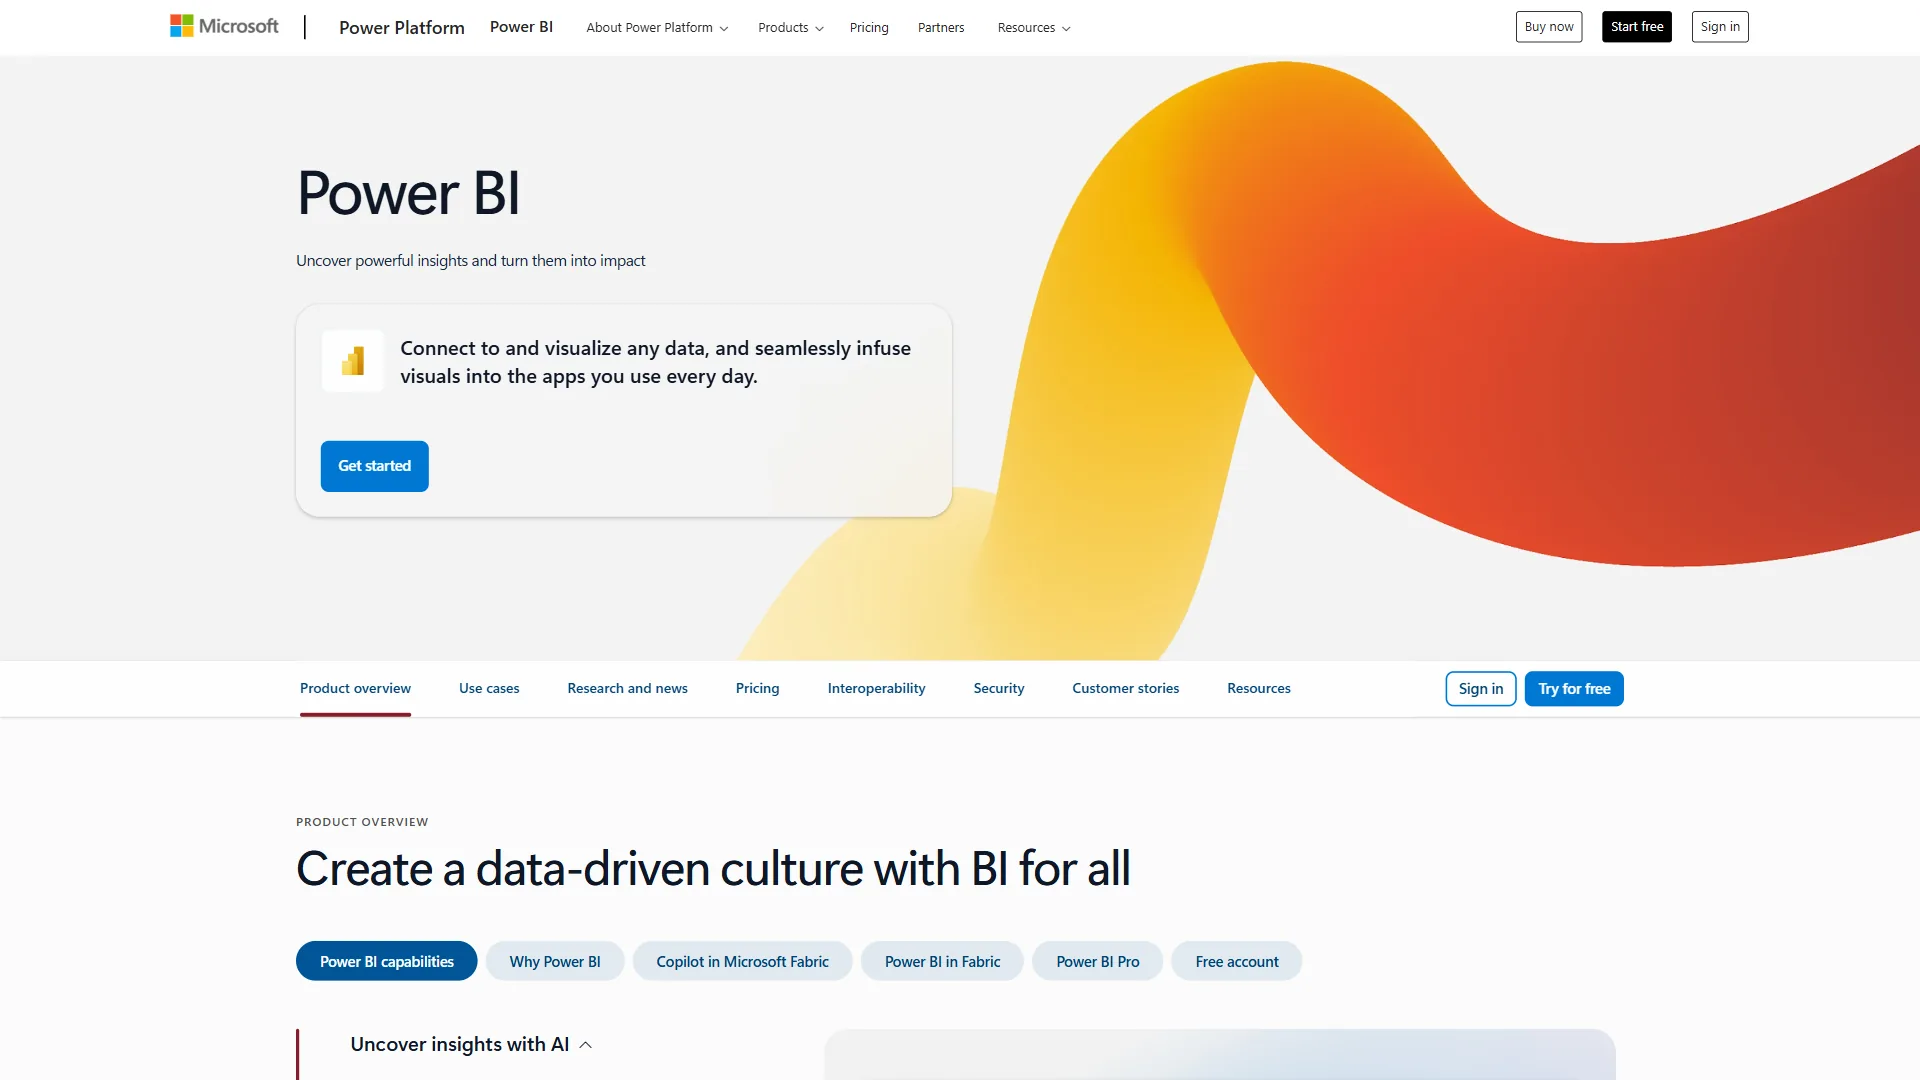
Power BI is the cheapest credible enterprise BI platform in 2026, with a free desktop tier and paid plans starting at $10 per user per month. Power BI remains the best entry point into enterprise BI, especially inside the Microsoft ecosystem.
What Makes Power BI Stand Out
Power BI Desktop is free for individual use. Pro starts at $10/user/month for cloud sharing. Premium - which adds dedicated capacity and advanced AI - starts at $24/user/month, a fraction of Looker’s $36,000/year floor (see our Power BI vs Tableau breakdown).
Microsoft integration is seamless inside Azure, Office 365, or Dynamics 365: governance flows through from Entra ID, reports embed in Teams, and Excel users connect to Power BI datasets natively.
AI Capabilities in Power BI
Power BI’s Q&A feature lets users type questions like “show me sales by region last quarter” and get instant visualizations. AI insights also scan for anomalies, trends, and correlations - when sales drop 15% in the Northeast, Power BI flags it and suggests contributing factors.
Limitations
Governance gets messy at scale. Unlike Looker’s LookML definitions, Power BI lets each user define metrics independently - the classic “17 different revenue calculations” problem. Data modeling uses Power Query (M language) with measures in DAX, both of which carry a steep learning curve.
Power BI Pricing
- Free: Desktop app for local use
- Pro: $10 per user/month (cloud sharing, collaboration)
- Premium Per User: $24 per user/month (AI features, paginated reports)
- Premium Per Capacity: Starting at $4,995/month (dedicated cloud resources)
2. Tableau: Best Visualization Capabilities
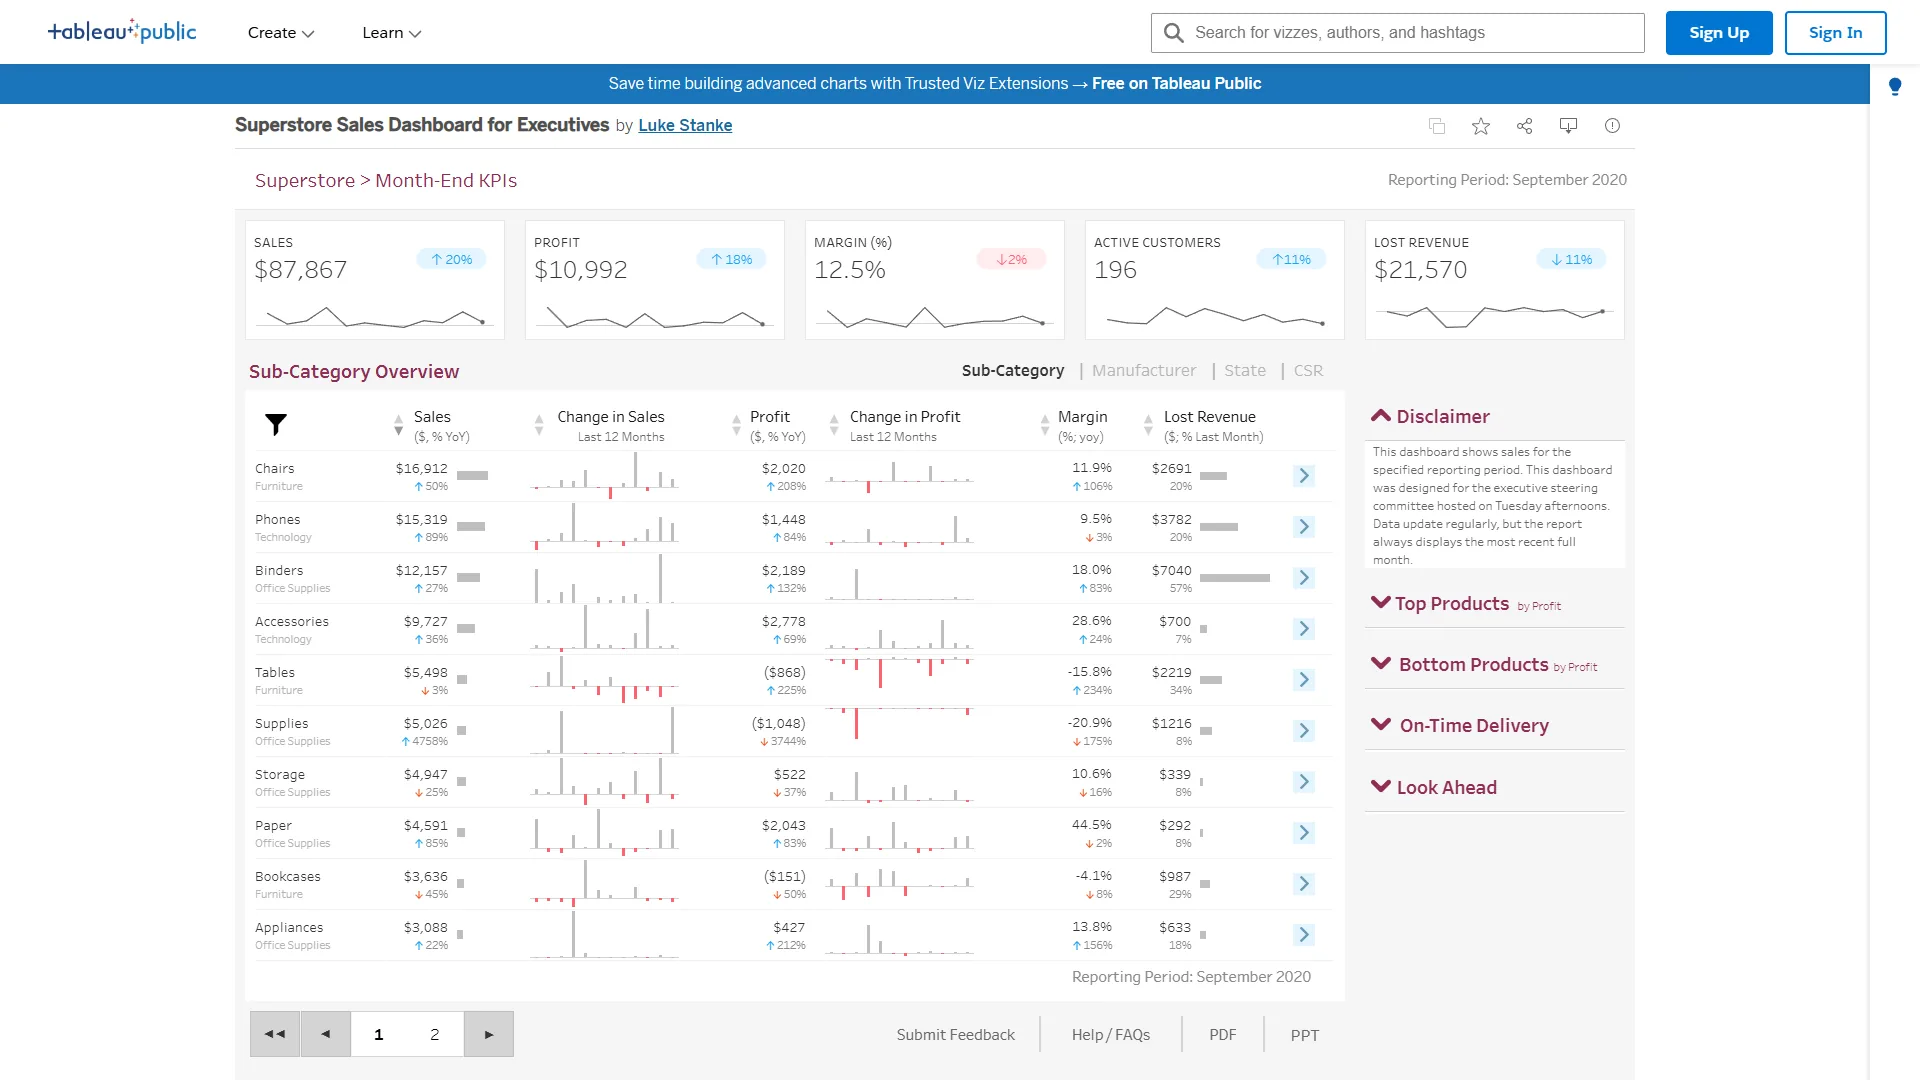
Tableau is the best BI tool for visualization quality, offering more chart types and finer formatting control than any other major platform. Tableau has been the visualization gold standard for over a decade.
What Makes Tableau Stand Out
If you can imagine a chart type, Tableau can build it - including hierarchical treemaps and dual-axis combination charts via drag and drop. Its visual analytics encourages exploration over pre-defined reporting (see our best AI data visualization tools roundup).
AI Capabilities in Tableau
Tableau’s Einstein Discovery (from the Salesforce acquisition) provides automated pattern detection and predictive analytics in plain English: “Customer churn is 35% more likely when support tickets exceed 3 in a month AND product usage drops below 50% of baseline.” Ask Data now handles follow-up questions with context - “Show sales by region” then “Now break that down by product category” works as expected.
Limitations
Licensing adds up - each user needs a Creator, Explorer, or Viewer license, and only Creators can build new content. Data prep lives in Tableau Prep, a separate tool that feels disjointed compared to platforms with integrated prep.
Tableau Pricing
Pricing verified April 2026 from Tableau's pricing page:
- Viewer (Standard): $15/user/mo
- View and interact with dashboards
- Mobile and web access
- Read-only collaboration
- Best for: Stakeholders who consume reports
- Explorer (Standard): $42/user/mo
- Create views from existing data sources
- Web-based authoring
- Self-service analytics
- Best for: Business users building ad-hoc views
- Creator (Standard): $75/user/mo
- Full data modeling and dashboard creation
- Tableau Prep Builder access
- Connect to any data source
- Best for: Analysts and dashboard authors
Volume discounts are available for 100+ users.
3. Looker: Best for Enterprise Governance
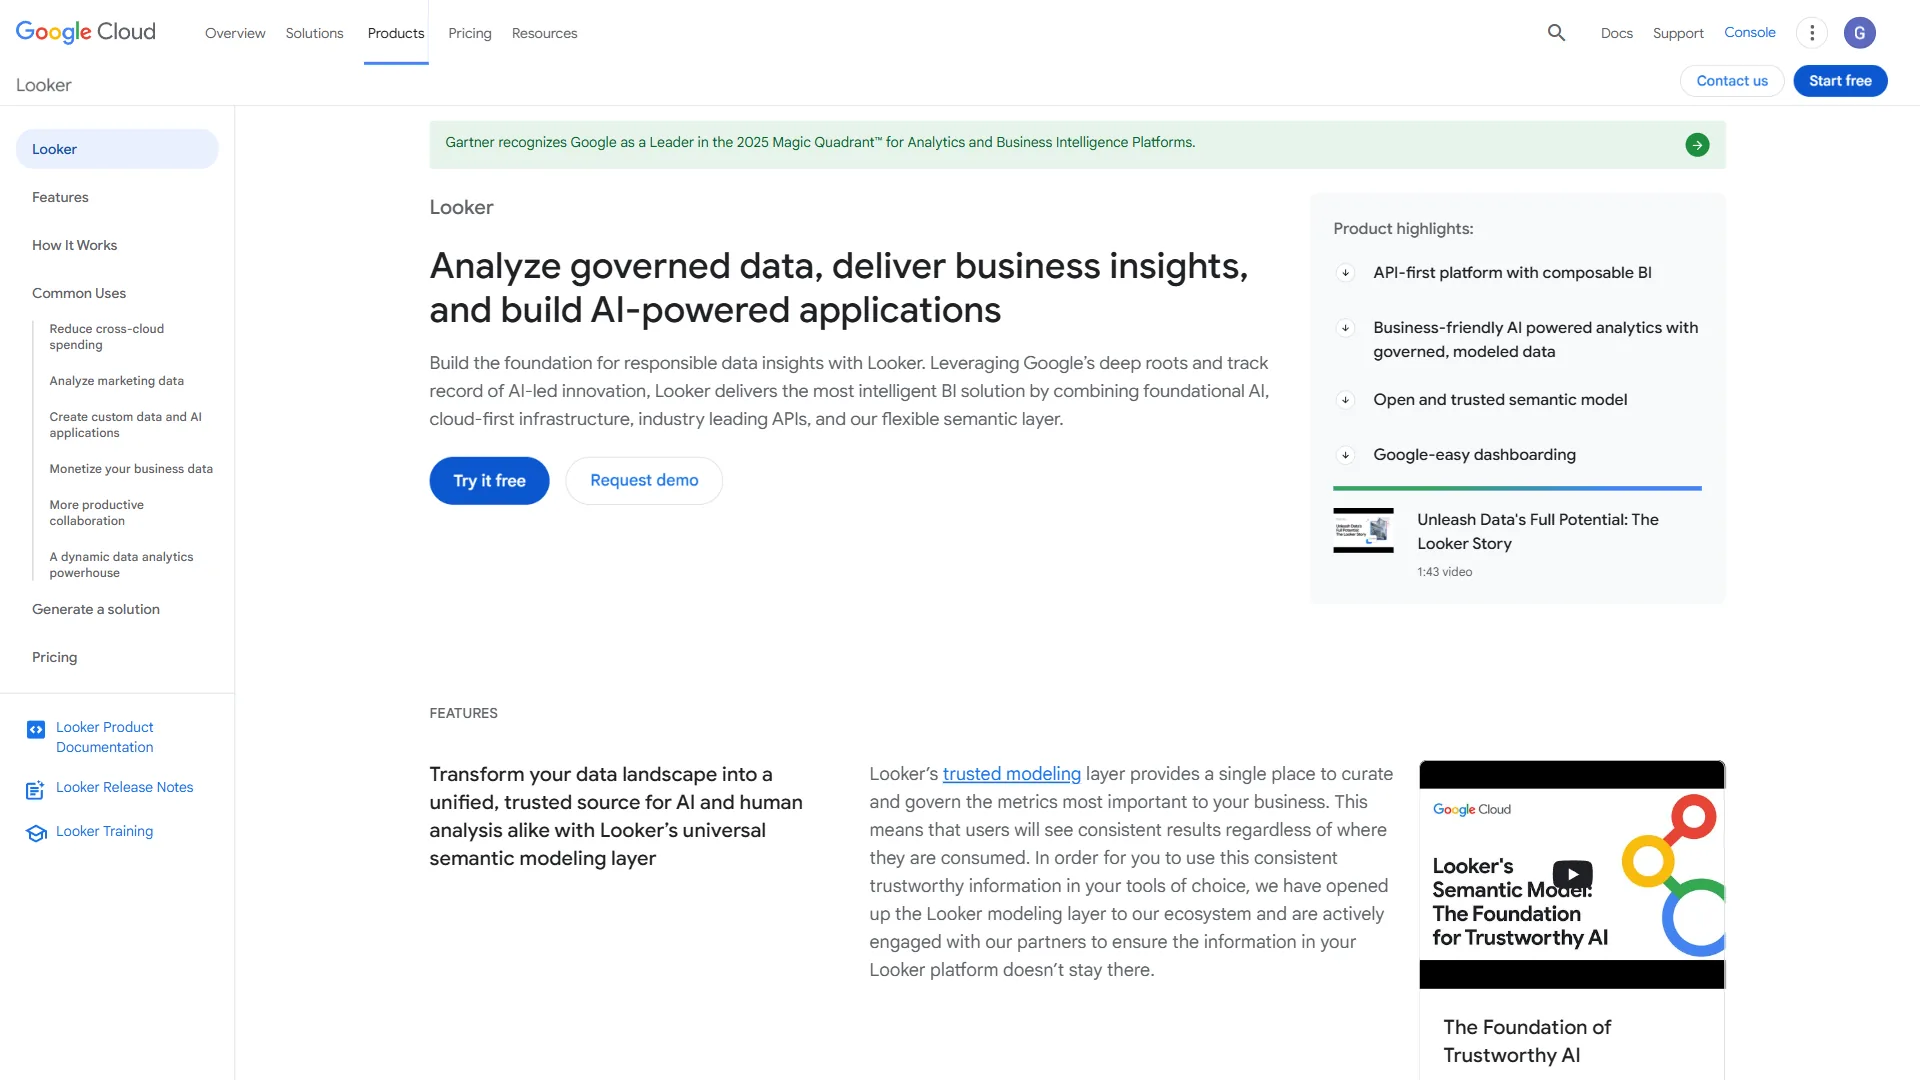
Looker is the best BI tool for enterprise governance, centralizing every metric definition in a single LookML modeling layer so every report uses the same calculation. Looker (now part of Google Cloud) takes a fundamentally different approach to BI: define business logic once, then let everyone use it consistently.
What Makes Looker Stand Out
The LookML modeling layer is Looker’s secret weapon. A data team defines “monthly recurring revenue” once in LookML, and every report, dashboard, and query referencing MRR uses the same calculation. This single source of truth eliminates the metric discrepancy meetings that plague other BI platforms. White-label embedded analytics is exceptional for SaaS products serving customer-facing dashboards (compare against the visual leader in our Looker vs Tableau review).
According to Pedro Arellano, Senior Director of Product at Google Cloud Looker, “Looker is built on a single, consistent data model that creates a shared definition of business metrics across an organization.”
AI Capabilities in Looker
Looker’s natural language querying understands business terminology because it is defined in LookML - ask “what is our MRR growth rate” and Looker knows exactly which calculation to use. Automated insights surface unusual patterns: if customer acquisition cost spikes 20% above the 30-day average, Looker alerts stakeholders before they open the dashboard.
Limitations
The LookML learning curve is real and requires a data team. Starting at $36,000/year, Looker is enterprise-priced and hard to justify under 50 users.
Looker Pricing
- Professional: $36,000/year (up to 10 users)
- Enterprise: $60,000-$360,000/year (scales with users and data volume)
- Embed: Custom pricing (white-label customer-facing analytics)
All pricing includes unlimited viewers; only creators and developers count toward user limits.
4. Domo: Best All-in-One Platform
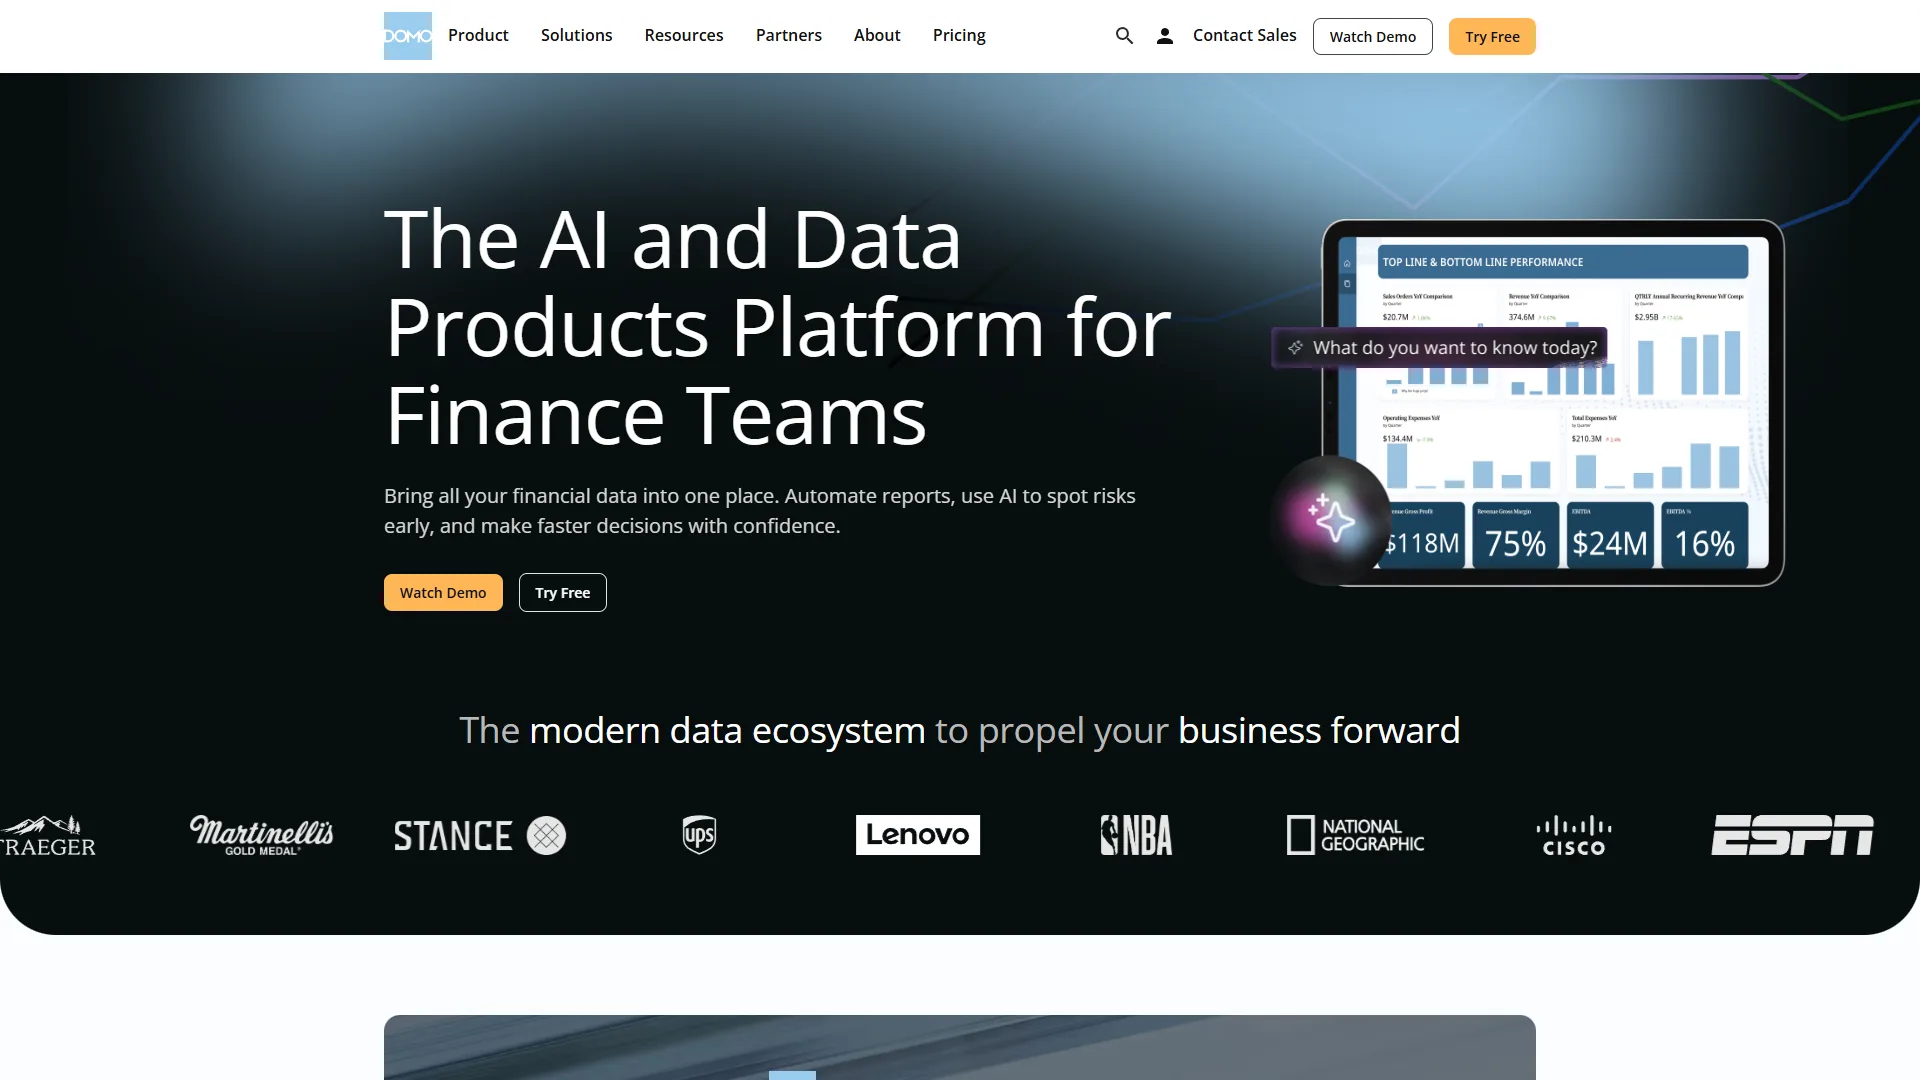
Domo is the best all-in-one BI platform, bundling 1,000+ data connectors, no-code ETL, dashboards, and conversational analytics into one cloud product. Domo positions itself as an “operating system for business” rather than just a BI tool.
What Makes Domo Stand Out
The connector library is staggering: over 1,000 pre-built connectors to databases and SaaS tools. If your data lives in Shopify, Google Ads, NetSuite, and PostgreSQL, Domo pulls it together without custom API work (see our Domo vs Power BI breakdown). The no-code Magic ETL tool uses a visual drag-and-drop canvas - no SQL required - which democratizes data prep beyond the data engineering team.
AI Capabilities in Domo
Domo’s AutoML lets business users build predictive models by pointing and clicking - select your data, choose “predict customer churn,” and AutoML builds, tests, and deploys the model. Conversational analytics (from the Birst acquisition) answers questions in natural language and suggests follow-ups: “I notice revenue is down 12% for Product A - would you like to see which regions are affected?”
Limitations
Pricing is opaque, with final cost varying widely by users, data volume, and features. The platform also tries to do everything - BI, ETL, project management, alerts, collaboration - which feels bloated for teams that just want analytics.
Domo Pricing
- Standard: Starting around $20,000-$40,000/year (scales with users)
- Enterprise: $50,000-$100,000+/year (advanced AI, premium support)
Exact pricing requires contacting sales. User licenses range from $30-$200 per month depending on role and features.
5. Qlik Sense: Best for Complex Data Exploration
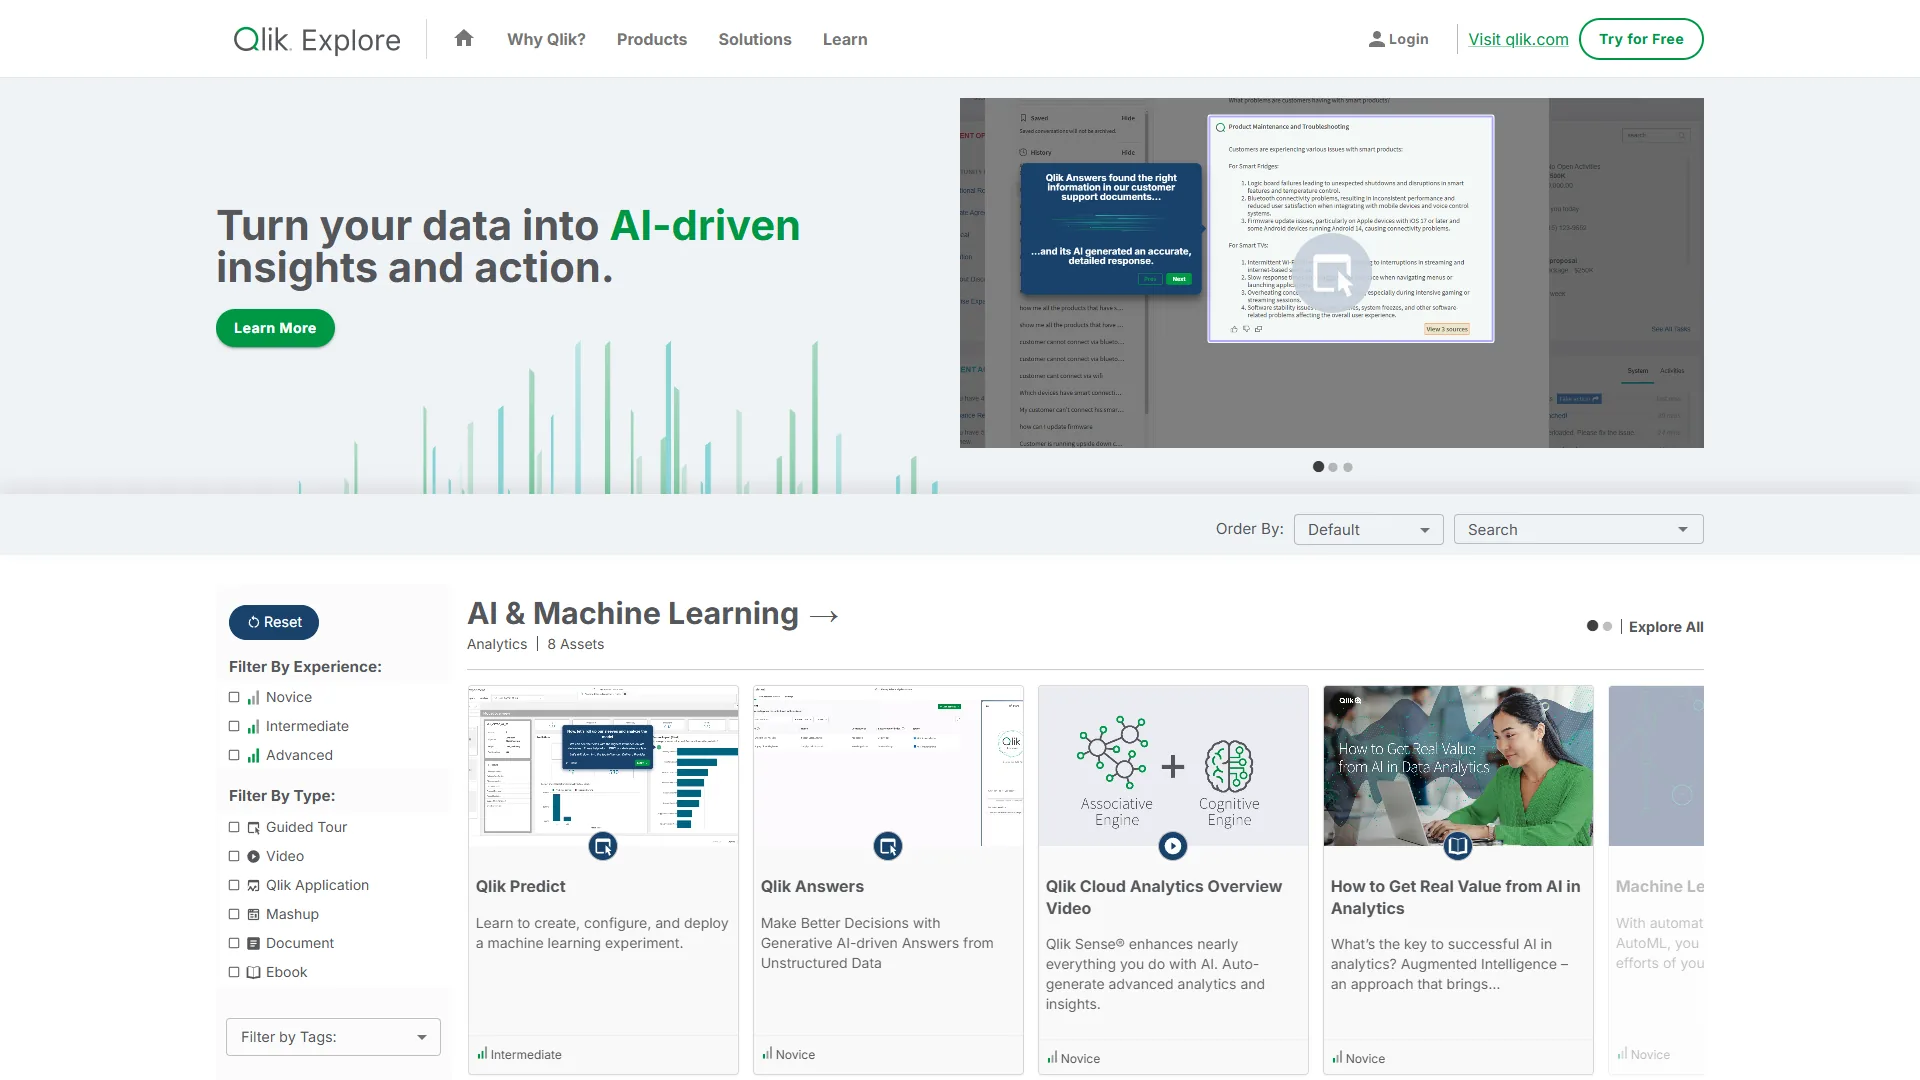
Qlik Sense is the best BI tool for complex data exploration, replacing pre-built drill-down paths with an associative engine that lets users pivot between any two dimensions instantly. Qlik Sense fundamentally changes how users explore data.
What Makes Qlik Sense Stand Out
The associative engine is Qlik’s killer feature. Instead of pre-defining drill-down paths (region to state to city), users explore data in any direction. Click a product category and Qlik highlights all related customers, time periods, regions, and sales reps. Click a region and see all related products and reps. This surfaces hidden relationships - a user who notices an underperforming product + region + rep combination can investigate without filing a report request.
AI Capabilities in Qlik Sense
Qlik’s Insight Advisor uses machine learning to suggest visualizations based on selected data. Augmented analytics detect anomalies and correlations across your dataset, surfacing the contributing factors most likely to matter when a metric moves.
Limitations
The learning curve is steeper than Power BI or Domo, and Qlik Script (the proprietary data-loading language) is challenging without dedicated Qlik developers.
Qlik Sense Pricing
- Business: $30 per user/month (basic analytics)
- Enterprise: $70-$200 per user/month (advanced features, scalability)
- SaaS Edition: Starting at $2,700/month (includes 25 Professional users)
Volume discounts are available for larger deployments.
Which tool fits your organization
The right BI tool depends on three variables: budget, data team size, and the visualization complexity your decision-makers actually need.
Start with Budget Reality
If you are a team of 20 with $20,000/year to spend, Looker and Domo are off the table - Power BI at $10-$24/user/month is the obvious choice. Be honest about budget before falling in love with enterprise features.
Consider Your Data Team Size
Dedicated data engineers? Looker’s governance and Qlik’s associative engine make sense. Mostly business users? Domo’s no-code or Power BI’s Excel-like interface gets results faster. No data team? Start with Power BI’s free tier while you hire.
Evaluate Your Data Sources and Visualization Needs
Domo wins on connector breadth, Power BI wins for Microsoft-heavy stacks, and Looker works best with warehouses (BigQuery, Snowflake, Redshift) rather than direct SaaS connections. Tableau wins for complex custom visualizations; Power BI and Domo handle standard charts at lower cost; Looker’s white-label embedding suits customer-facing analytics.
Test Drive with Real Data
Every platform offers trials. Do not test with sample data - load your real sources, build your common reports, and have your actual users try the interface. Watch refresh times, query performance, and whether natural language features work with your business terminology.
Frequently Asked Questions
What is the difference between BI tools and data analytics platforms?
The line has blurred. Traditional BI focused on reporting and dashboards; modern business intelligence platforms now include data preparation, advanced analytics, and ML that were once separate. Today’s BI platforms handle both use cases, which is why most published business intelligence tools list rankings now overlap with broader analytics platform reviews.
Do I need a data warehouse before implementing a BI tool?
Not necessarily. Power BI and Domo can connect directly to operational databases and SaaS apps, but performance and consistency improve with a dedicated warehouse. For millions of rows or joins across many sources, invest in a warehouse like Snowflake or BigQuery alongside your BI tool.
Can these tools handle real-time data?
Yes, but definitions vary. Power BI supports DirectQuery, Domo offers Streaming DataSets with sub-minute refresh, and Looker connects live to data warehouses. Tableau and Qlik also support live connections. The bottleneck is usually your source system’s query performance.
How long does BI implementation typically take?
Plan for 2-4 weeks minimum for initial setup with a few data sources. Comprehensive org-wide implementations take 3-6 months. Looker and Qlik require more upfront investment but pay back through governance; Domo shows results faster but may need refactoring later.
What about open-source alternatives like Metabase or Apache Superset?
Open-source BI tools work well for technical teams comfortable with self-hosting. They lack enterprise support, pre-built connectors, and AI features of commercial platforms - useful as a quick reference guide to lower-cost analytics for startups with strong engineering. Any honest top 10 bi tools shortlist for 2026 should include at least one of these, alongside the paid leaders.
Are there any BI tools 2026 free options worth considering?
Yes. Power BI Desktop is fully free for individual analysts, and Looker Studio (formerly Data Studio) remains free for unlimited dashboards on Google data sources. Metabase and Apache Superset are the strongest open-source BI tools 2026 free choices for teams willing to self-host. For a side-by-side bi tools comparison of free vs paid tiers, see the pricing rows in the table above.
Final Verdict: The Best BI Tools 2026 for Every Scenario
Here is the bottom-line recommendation for each scenario:
Small businesses (under 50 users) with Microsoft tools: Start with Power BI - free tier to evaluate fit, affordable paid tiers as you grow.
Design-conscious organizations that prioritize visualization quality: Choose Tableau - premium per-user pricing is justified when executives decide from dashboards.
Mid-to-large enterprises (100+ users) that need governance: Implement Looker - LookML’s upfront investment pays back in metric consistency.
Growing companies (20-200 users) that want simplicity: Go with Domo - no-code and the connector library let you move fast without a data engineering team.
Analyst-heavy teams exploring complex data relationships: Pick Qlik Sense, whose associative engine is ranked by real users as the most flexible exploration model on the market.
Whatever your budget and technical sophistication, the 2026 BI landscape has a platform that turns your data into decisions.
Related Reading
The five tools covered above each link to a dedicated review with pricing, features, and competitor comparisons:
- Looker - Enterprise BI with semantic modeling
- Tableau - Visual analytics platform
- Power BI - Microsoft business intelligence
- Domo - Cloud BI with 1,000+ connectors
- Qlik Sense - Associative analytics engine
More analytics guides:
- Best Business Intelligence Tools 2026 - BI platform comparison
- AI Analytics Platforms Comparison - Analytics with AI features
- Best AI Project Management Tools - Project analytics
External Resources
The following independent sources informed this comparison and offer additional context on AI adoption and BI market trends: