


Most teams don’t have a data problem - they have a visualization problem. Numbers exist in spreadsheets, databases, and SaaS dashboards, but turning them into something stakeholders understand is where everything breaks down.
The best AI data visualization tools split into two camps: enterprise platforms for dedicated analysts, and flexible workspace tools anyone can use without a data science degree. Tableau and Notion lead each camp; the right pick depends on technical depth, budget, and how central data storytelling is to your workflow.
Here’s the breakdown - real pricing, measured ROI, integrations, and who each tool serves.
Methodology
Our methodology is research-based: each tool is evaluated against six criteria drawn from current vendor documentation, published pricing pages, and independent analyst research rather than sponsored placement. AI Productivity may earn a commission from links on this page; our rankings are editorially independent. The criteria:
- AI Feature Depth - Does AI actually accelerate insight discovery, or is it a chatbot on a charting library? See best AI analytics platforms comparison.
- Learning Curve - How long until the team produces useful visualizations?
- Pricing Transparency - Exact tier breakdowns, not “contact sales” hand-waving.
- Integration Ecosystem - Connections to existing data sources and workflows.
- ROI Evidence - Measurable time savings or better decisions.
- Role Fit - Which teams and skill levels get the most value.
This guide also fills gaps competitor “best of” lists skip - pricing tables, ROI metrics, and concrete who-should-use guidance.
Comparison Table
The comparison table below shows Tableau and Notion side by side on price, AI features, learning curve, integrations, and free-tier availability so you can pick the right fit in one scan.
| Feature | Tableau | Notion |
|---|---|---|
| Starting Price | $15/user/mo (Viewer) | Free |
| Full Creator Price | $75/user/mo | $18/user/mo (Business) |
| AI Features | Tableau Agent, Pulse, Ask Data (NLP) | AI Agents (GPT-5, Claude, o3), AI summaries |
| Best For | Enterprise BI, complex analysis, visual storytelling | Team dashboards, lightweight analytics, all-in-one workspace |
| Learning Curve | Steep (weeks to months) | Moderate (days to weeks) |
| Data Sources | 100+ native connectors | 30+ integrations, API connections |
| Free Tier | No (Tableau Public only) | Yes |
| Rating |
Quick verdict: Tableau is the industry standard for analytical depth and polished interactive dashboards. Notion is the better fit for lightweight visualization inside an all-in-one workspace without hiring a BI analyst.
1. Tableau - Best for Enterprise Data Visualization and Interactive Dashboards
Tableau () has been the gold standard in data visualization since long before “AI” became a mandatory checkbox. Acquired by Salesforce in 2019, it remains what dedicated data teams reach for to build interactive dashboards, explore complex datasets, and tell visual stories that drive executive decisions.
What separates Tableau from lighter tools is depth - calculated fields, LOD expressions, and multi-source data blending are table stakes. For teams with even one dedicated analyst, that depth translates directly into better insights.
AI Features That Actually Matter
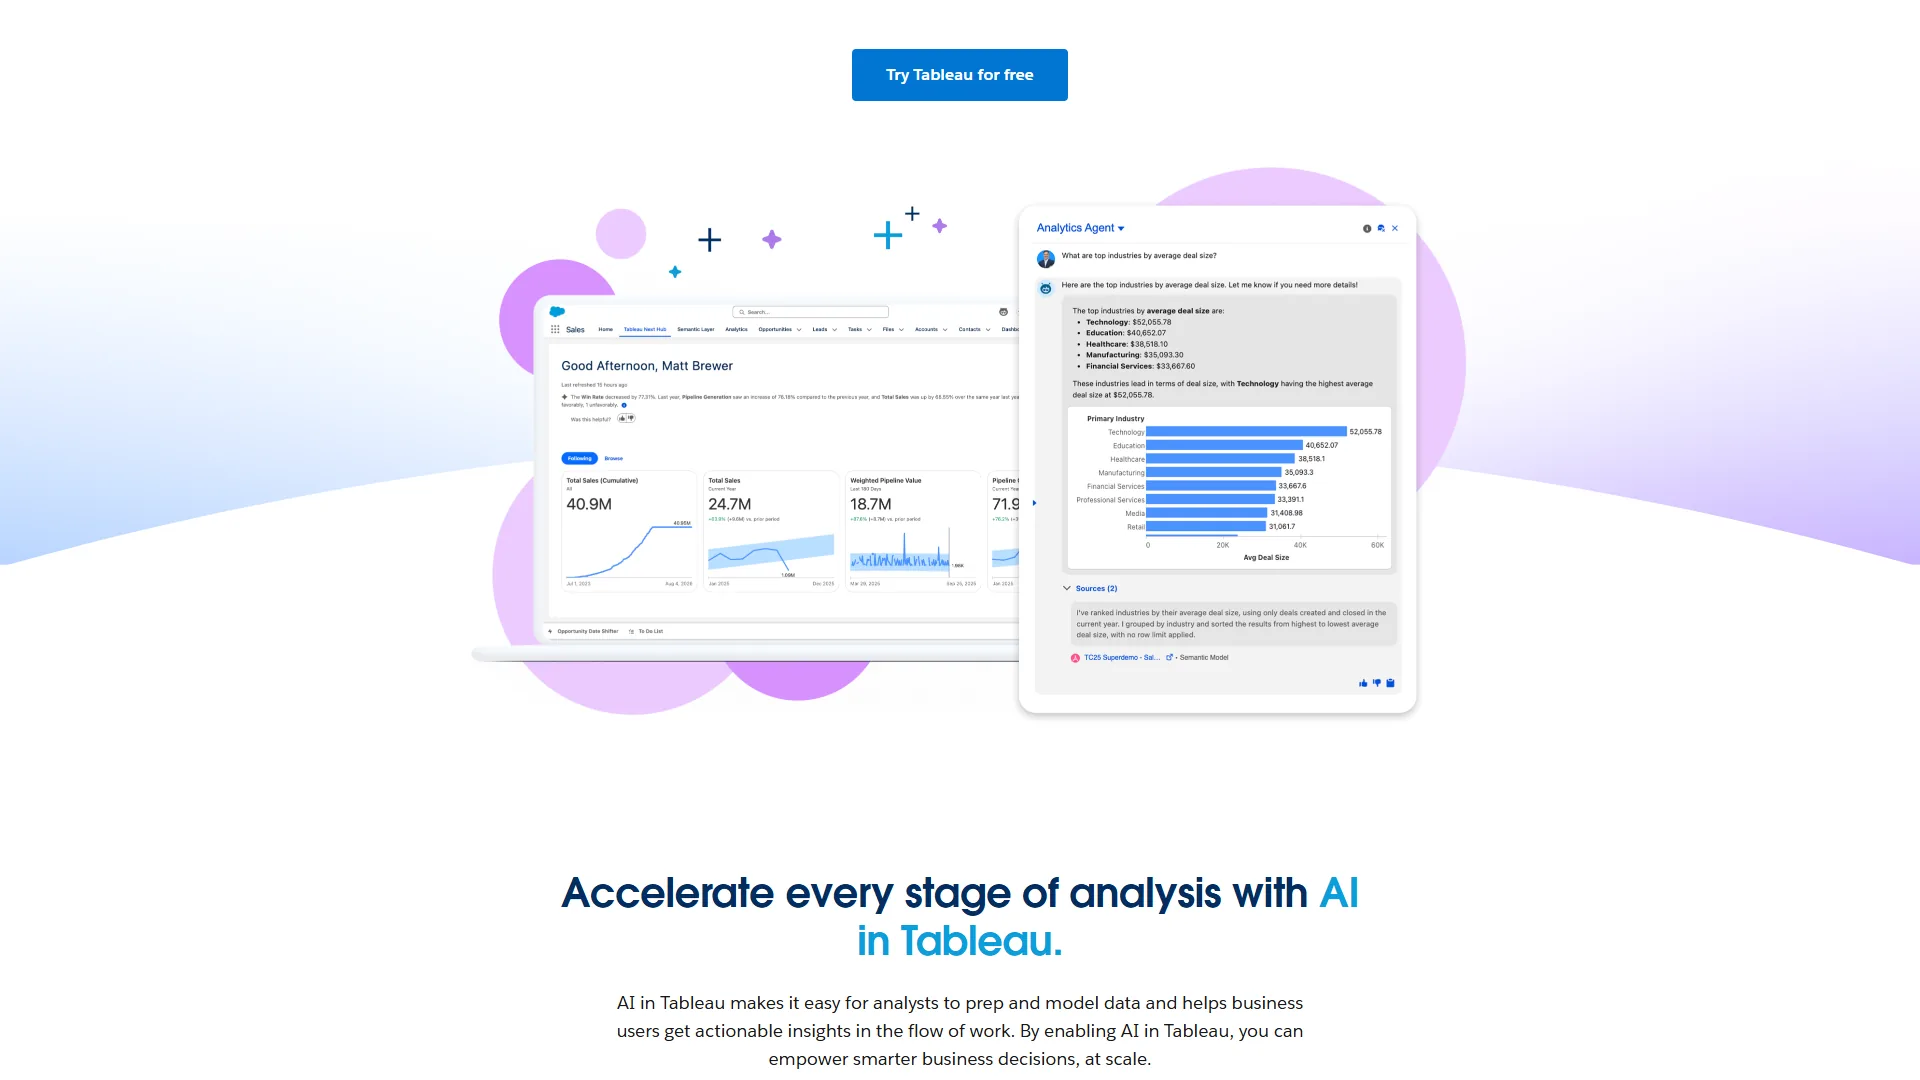
Tableau Agent (formerly Einstein Copilot) is Tableau’s conversational assistant, detailed on Tableau’s AI product page. Ask plain-English questions and it generates the visualization - quality depends on data modeling.
Tableau Pulse delivers proactive AI insights, covered on the official Tableau Pulse page - it monitors metrics and surfaces anomalies, trend changes, and forecasts automatically.
Ask Data lets users type natural language queries against published data sources. It now handles multi-table joins, date math, and comparative queries - dramatically reducing the BI team’s “quick questions” backlog.
Explain Data provides AI-generated explanations for unexpected values. Click an anomalous data point and Tableau surfaces the contributing factors, saving analysts hours of manual drill-down.
What Needs Work
Tableau’s learning curve is real. Basic bar charts are straightforward, but the platform’s power lives in LOD expressions, table calculations, parameter actions, and set operations - features that take weeks or months to master. Organizations that skip training end up with underutilized licenses.
The three-tier pricing creates complexity. A team of 5 creators and 20 viewers runs $675 per month before Server or Cloud hosting; Enterprise pushes creators to $115 per user/month.
Tableau’s mobile experience has improved but still feels desktop-first. Phone-heavy stakeholders will need mobile-specific layouts.
Real ROI Data
Tableau’s business impact is well-documented through independent studies. According to the Forrester Total Economic Impact study commissioned by Tableau, “organizations using Tableau realized a 127 percent return on investment over three years with a payback period of thirteen months.” Headline figures:
- Forrester TEI Study: 127% ROI, 13-month payback, $1.9M efficiency gains over three years.
- Charles Schwab: 250,000 hours saved in two years across 14,000+ employees - equivalent to 120 FTEs.
- HelloFresh: Cut analysis time from 5 days to under 1 day, enabling real-time campaign optimization.
- Manufacturing case: Prevented $4M in stockout losses and generated $8M annual revenue from faster insights.
These figures come from large deployments. For a 10-person team the math differs, but modest weekly-reporting time savings justify the investment within 6-12 months.
Who Should Use Tableau
Ideal for: Enterprise data teams, BI pros, orgs with dedicated analysts, Salesforce ecosystem users, teams building client-facing embedded analytics. The Tableau vs Power BI deep dive shows where each fits.
Not ideal for: Solo operators, teams without analytical staff, quick-setup dashboard needs, budget-constrained small businesses.
Pricing Breakdown
| Tier | Standard | Enterprise |
|---|---|---|
| Viewer | $15/user/mo | $35/user/mo |
| Explorer | $42/user/mo | $70/user/mo |
| Creator | $75/user/mo | $115/user/mo |
All prices billed annually. Creator licenses required for building workbooks. Enterprise tiers add advanced management, data governance, eLearning, and support for up to 10 sites.
Hidden cost: Tableau Cloud is included, but on-premises Server deployments need separate infrastructure and admin budget. Factor 20-40 hours of training per analyst to reach proficiency.
2. Notion - Best for Flexible Data Visualization in an All-in-One Workspace
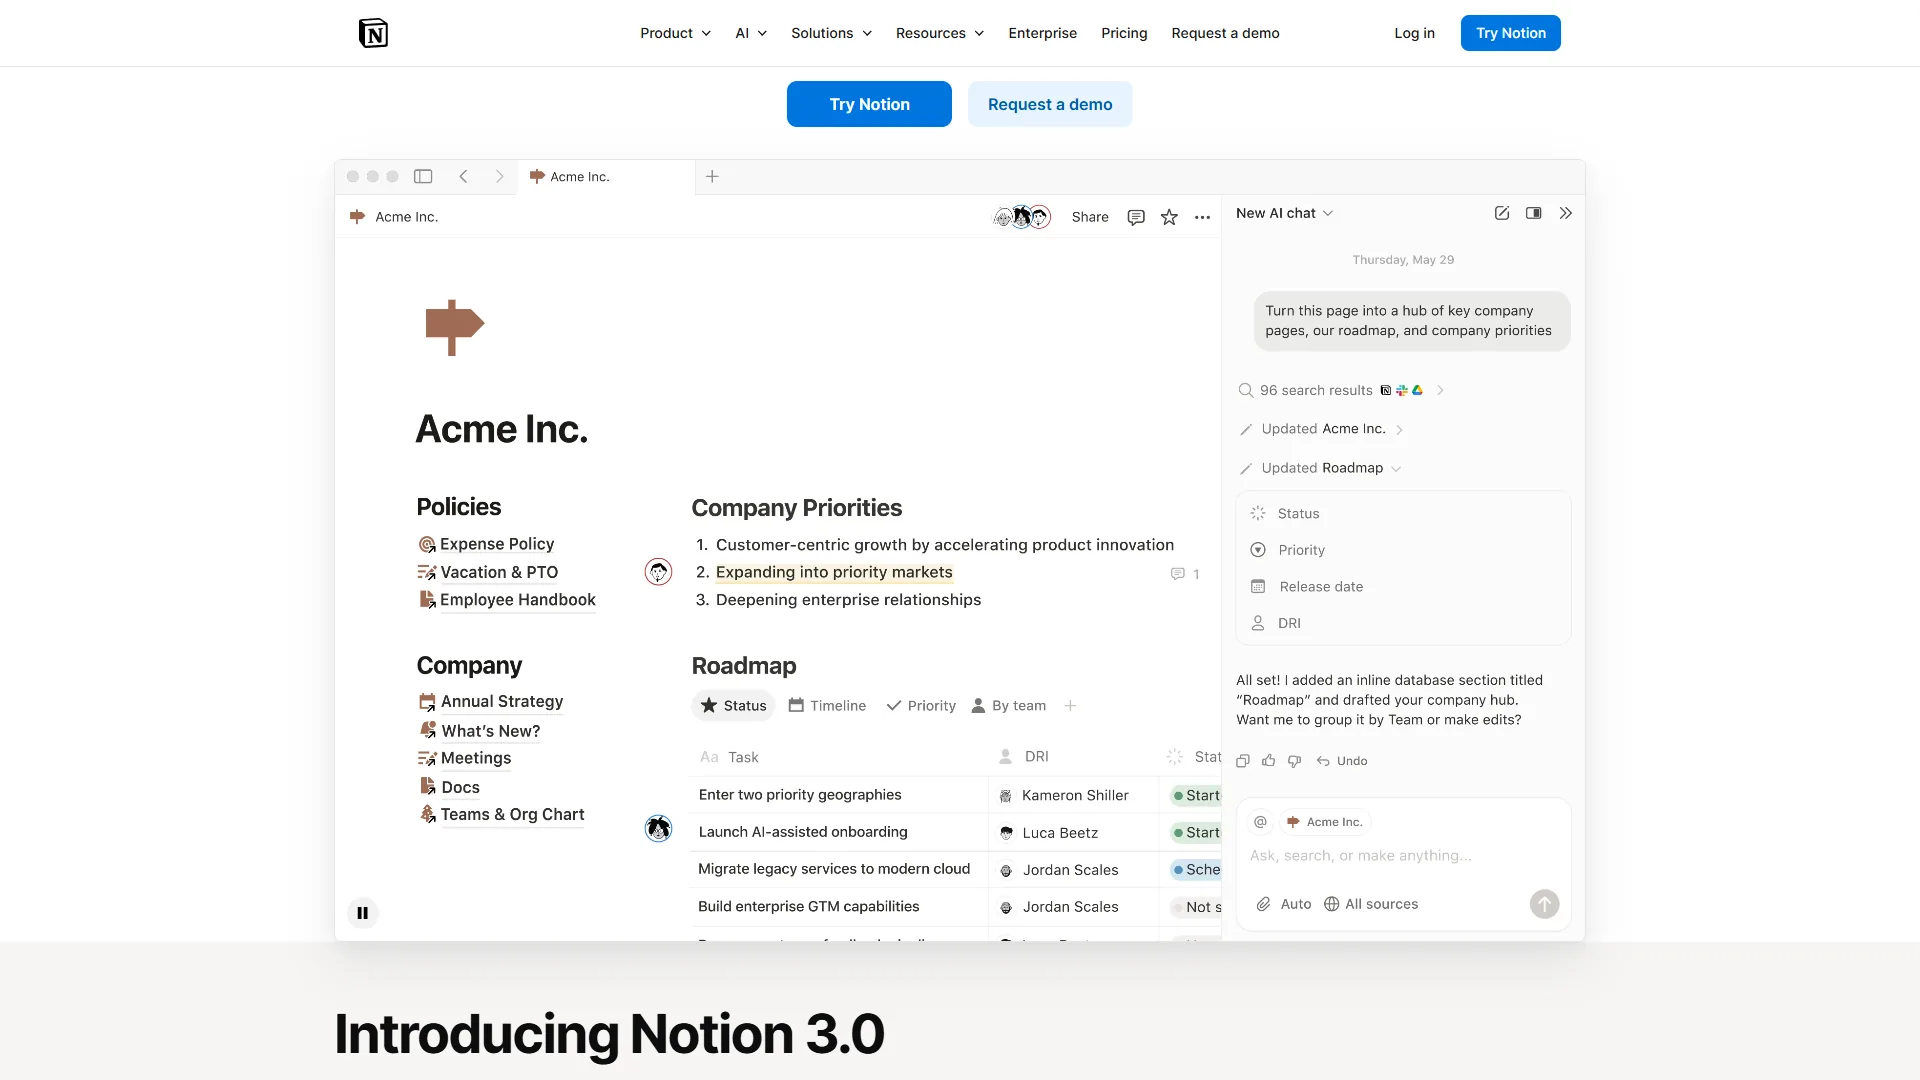
Notion () is not a traditional data visualization platform - and that is precisely why it belongs here. For teams that need to visualize project data and track KPIs without enterprise BI, Notion’s database-native approach is faster, cheaper, and more practical than traditional BI.
Notion databases support multiple views (tables, boards, timelines, calendars, galleries, and charts) powered by the same underlying data. Add AI summaries and natural-language querying and you have a workflow most small-to-midsize teams adopt in days.
AI Features That Actually Matter
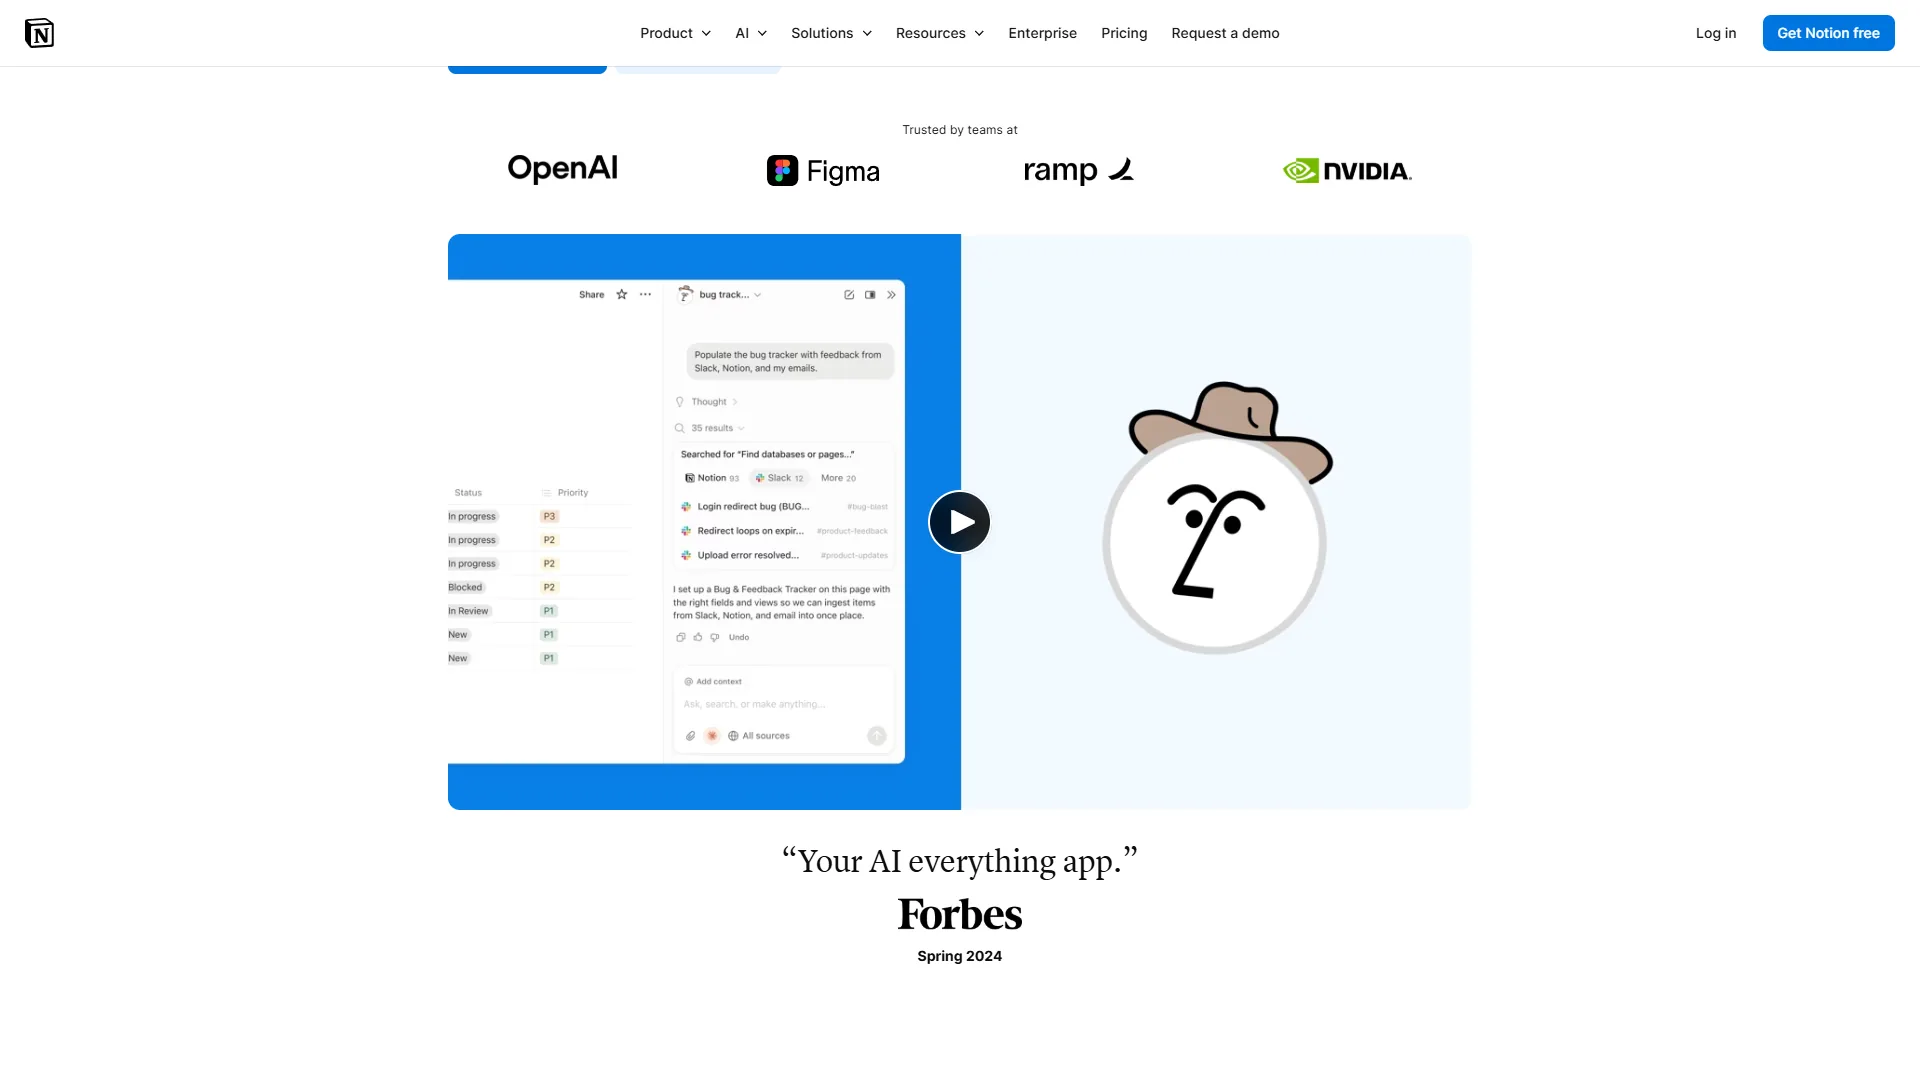
AI Agents are Notion’s most significant recent addition, described on Notion’s AI product page. Running on GPT-5, Claude Opus 4.1, and o3, agents autonomously summarize meeting notes, update trackers, and generate reports - you can ask one to analyze a database, identify trends, and create a summary page with charts without touching a filter.
AI Summaries and Q&A let you query Notion databases in plain language. “What percentage of Q4 deals closed above $50K?” pulls the answer from your CRM database - cross-referencing requires a question, not SQL.
Database Charts build directly into Notion’s database views - bar, line, pie, and more from any property, updating in real time with filters and formulas. They cover 80% of internal reporting needs.
AI-Powered Automation pulls context from calendar, Slack, and other integrations into dashboards - meeting notes get transcribed and linked to project databases automatically.
What Needs Work
Notion’s visualization is useful but limited versus dedicated BI - no multi-axis charts, scatter plots with regression lines, or geospatial visualizations. Statistical depth hits walls quickly.
Performance degrades with large datasets. Databases over 10,000 rows feel sluggish, and complex formulas across linked databases add lag. Enterprise BI handles millions of rows; Notion is not designed for that scale.
Full AI features require the Business plan ($18 per user/month). Free and Plus users get limited or no AI, gating the visualization capabilities that make Notion compelling here.
Chart types are still relatively basic - bar, line, donut, and a few others - with minimal customization for colors, annotations, and formatting compared to Tableau, Power BI, or Looker Studio.
Real ROI Data
Notion’s productivity impact comes from consolidation rather than visualization-specific gains:
- Osaka Gas (3,000 employees): 35% reduction in info-search time.
- Remote.com (1,400 employees): 300 daily AI queries saving 10 min each - ~50 hours daily.
- Gartner research: Tool consolidation shows 27% annual software cost reduction.
The ROI case is strongest for teams juggling separate spreadsheets, trackers, and reporting tools - consolidating eliminates manual sync errors.
Who Should Use Notion
Ideal for: Small-to-midsize teams, startups, project managers, content/ops teams needing lightweight dashboards, orgs consolidating tools. The Looker vs Tableau and Domo vs Tableau breakdowns cover Tableau’s enterprise rivals.
Not ideal for: Data science teams, complex analytical workloads, geospatial/statistical visualizations, high-volume data (10,000+ rows).
Pricing Breakdown
| Tier | Monthly Price | AI Access |
|---|---|---|
| Free | $0 | Limited |
| Plus | $12/user/mo ($10 annual) | Limited |
| Business | $18/user/mo ($15 annual) | Full AI with multi-model agents |
| Enterprise | Custom | Full AI with advanced security |
Business is the sweet spot - unlimited AI, multi-model access, autonomous agents, and advanced page analytics. A 10-person team runs $180/month ($150 annual) - roughly two Tableau Creator licenses.
Feature-by-Feature: Tableau vs Notion
Choosing between these tools is less about “better” and more about which problem you are solving.
Data Complexity
Tableau wins decisively. Multi-source blending, statistical calculations, forecasting, and interactive drill-down across millions of rows are purpose-built. Notion tops out at basic aggregations and simple formulas.
The threshold: Choose Tableau to answer “why did revenue drop 12% in the Southeast last quarter?” Choose Notion to answer “are we on track for Q1 goals?” The best business intelligence tools 2026 guide covers heavier BI options.
Learning Curve and Time to Value
Notion wins here. A non-technical user builds a working chart dashboard in Notion in an afternoon. Tableau requires structured training - 20-40 hours per analyst for basic proficiency, months for advanced features.
The real cost: Tableau licenses sit unused more often than admitted - the AI tools for data analysis guide covers self-service alternatives. A 2024 Gartner survey found 40% of enterprise BI licenses are underutilized. Notion’s lower barrier drives higher adoption and better ROI.
Integration Ecosystem
Tableau connects natively to 100+ data sources spanning every major database, cloud platform, and SaaS app - the Salesforce integration is particularly deep.
Notion integrates with 30+ tools via native connections plus API-based custom integrations. Slack, Google Calendar, and Zapier are strong; raw databases or warehouses require middleware.
For data teams: Tableau. For operational teams: Notion.
Cost Comparison for Common Team Sizes
| Team Size | Tableau (Mixed) | Notion Business |
|---|---|---|
| 5 users | $435/mo (2 Creators, 3 Viewers) | $90/mo |
| 10 users | $720/mo (3 Creators, 7 Viewers) | $180/mo |
| 25 users | $1,155/mo (5 Creators, 20 Viewers) | $450/mo |
| 50 users | $2,250/mo (10 Creators, 40 Viewers) | $900/mo |
Both assume annual billing. Tableau Enterprise tier roughly 2x Standard.
When to Use Both
Some organizations run both: Tableau for heavy analytics (financial modeling, customer segmentation, supply chain) and Notion as the operational layer for projects and daily dashboards. The key is avoiding overlap.
What About Power BI, Looker Studio, and Others?
The broader landscape includes several platforms worth mentioning:
Power BI ($14 per user/month for Pro) is the budget-conscious enterprise choice for Microsoft 365 orgs - Microsoft’s Power BI documentation covers the full feature set. Roughly 80% of Tableau’s functionality at a fraction of the cost.
Looker Studio (free) is Google’s visualization layer for BigQuery and Google Analytics - the fastest zero-cost path to dashboards for Google-ecosystem marketing teams.
ThoughtSpot focuses on AI-driven search analytics - type a question, get a chart. Strong for self-service business users.
Julius AI lets you upload CSVs and ask questions in natural language - best for quick ad-hoc analysis, not ongoing dashboards.
Domo targets cloud-native organizations wanting BI, integration, and app development in one platform. Strong for 500+ employee orgs with complex pipelines.
Zoho Analytics is the budget option for small businesses in the Zoho ecosystem - AI-powered insights at a fraction of enterprise BI pricing.
Each fills a specific niche with tradeoffs: Power BI locks you to Microsoft, Looker Studio struggles with non-Google data, ThoughtSpot pricing is opaque, and Domo is overkill for small teams. Tableau and Notion lead this guide because they represent the two most common use cases - enterprise analytical depth and accessible all-in-one visualization.
Best Picks by Use Case for the Best AI Data Visualization Tools
The best pick depends on team profile: enterprise data teams with dedicated analysts should pick Tableau, while small teams, startups, and operations groups that need lightweight dashboards inside an all-in-one workspace are better served by Notion.
Start With Your Team Profile
| If You Are… | Choose | Why |
|---|---|---|
| A data team with dedicated analysts | Tableau | Depth, flexibility, enterprise scale |
| A startup or small team tracking KPIs | Notion | Fast setup, affordable, all-in-one |
| A Salesforce-centric organization | Tableau | Native integration, shared data model |
| A team that needs docs + dashboards | Notion | Single workspace for everything |
| An organization with 50+ dashboard consumers | Tableau | Viewer licenses at $15/mo scale efficiently |
| A budget-constrained team under 20 people | Notion | Business tier at $15-18/user covers everything |
Questions to Ask Before Committing
-
Do you have someone who can build dashboards? If not, Tableau licenses collect dust. Notion’s lower barrier drives more actual creation and consumption.
-
How complex is your data? Multi-source blending and statistical/geospatial analysis require Tableau. Single-source tracking and project metrics work in Notion.
-
What is your budget? Tableau Standard for 10 users runs $720/month minimum; Notion Business runs $180/month. The $540/month difference buys other tools.
-
Where does your data live? Tableau connects to everything. Notion works best with data that lives inside Notion or flows in via integrations - not the right layer for a Snowflake warehouse.
-
How important is visual polish? Tableau produces publication-quality dashboards; Notion charts are clean but basic.
The Bottom Line
Tableau is the best AI data visualization tool for enterprise analytical depth, while Notion is the best choice for lightweight team dashboards inside an all-in-one workspace. The right pick depends on whether your bottleneck is analytical complexity or team adoption, not feature-list length.
Tableau remains unmatched for enterprise-grade visual analytics, complex data exploration, and polished interactive dashboards - Tableau Agent, Pulse, and Ask Data genuinely accelerate the path from raw data to insight, but the investment and learning curve demand committed users.
Notion has quietly become one of the most practical data visualization tools for teams without dedicated analysts. Database charts, AI agents, and natural-language queries make useful dashboards possible without a BI platform. The trade-off is analytical depth - worth making for most teams.
Start with one, get adoption right, and measure whether your team actually makes better decisions with what they create.
FAQ
The FAQ below answers the most common questions readers ask about choosing an AI data visualization tool, including ChatGPT’s role, the top picks for 2026, and which platform fits which workflow.
Q: Can ChatGPT do data visualization?
ChatGPT is not a true data visualization tool, though its Advanced Data Analysis mode can generate one-off charts from uploaded CSVs using Python. For ongoing dashboards, recurring reports, or live data connections, a purpose-built platform such as Tableau, Power BI, or Notion is the right choice.
Q: What are the top 5 data visualization tools?
The top five data visualization tools in 2026 are Tableau for enterprise analytics, Power BI for Microsoft-centric teams, Notion for all-in-one workspaces, Looker Studio for Google ecosystem data, and ThoughtSpot for AI-driven search analytics.
Q: Which AI tool is best for visuals?
Tableau is the best AI tool for polished, publication-quality visuals thanks to Tableau Agent, Pulse, and Ask Data. For lightweight, in-workspace charts that anyone on the team can build, Notion’s database charts and AI agents are the better fit.
Q: What is the best AI tool to analyze data?
The best AI tool to analyze data depends on dataset size and team skill: Tableau wins for multi-source analytical depth, Notion wins for lightweight project and KPI analysis, and Julius AI is the strongest pick for fast, ad-hoc CSV analysis through natural language.
Q: What are the top 5 AI data visualization tools?
The top five AI data visualization tools in 2026 are Tableau for enterprise analytical depth, Notion for flexible all-in-one workspace dashboards, Power BI at $14 per user per month for Microsoft 365 teams, Looker Studio free for Google ecosystem users, and ThoughtSpot for AI-driven search analytics. Julius AI and Domo round out common picks.
Related Reading
Related reading covers deeper reviews, head-to-head comparisons, and adjacent workflows for extending your visualization stack.
- Tableau Review - Full enterprise visualization review
- Notion Review - All-in-one workspace with database charts
- Tableau vs Power BI: The Honest Comparison for 2026 - Head-to-head deciding guide
- How to Create Reports with AI - Raw data to polished presentations
- Best AI Spreadsheet Tools 2026: Google Sheets vs Airtable - For spreadsheet-first teams
- Best Data Analytics Platforms for 2026 - Databricks, Power BI, Tableau, Looker
External Resources
External resources include official vendor training and independent analyst research to verify the claims in this guide at source.
- Tableau Training and Tutorials - Official learning paths, beginner to advanced
- Notion Help Center and Guides - Databases, charts, and AI features
- Forrester Research: Business Intelligence - Independent BI platform research and ROI benchmarks