


How to create reports with AI is a workflow that compresses hours of manual data processing into 30 to 45 minutes by letting tools like ChatGPT, Notion, and Gamma handle analysis, narrative drafting, and visual formatting - turning raw spreadsheets and feedback into polished deliverables for any professional context.
You have 47 browser tabs open, a spreadsheet that refuses to make sense, and a report due by end of day. Sound familiar? Report creation is one of the most universal pain points in professional work - not because the analysis is hard, but because the process of turning raw data into something a human actually wants to read involves a dozen tedious steps that eat hours out of your week.
AI changes the math entirely. Instead of spending three hours wrestling data into paragraphs and paragraphs into slides, you can use an AI report generator to compress that same workflow into 30 to 45 minutes - whether you work locally or need to create reports with AI online for distributed teams. This guide walks you through the exact process - from raw numbers to polished deliverables - using three tools that handle different parts of the reporting pipeline.
TL;DR: AI Reporting Tools Compared
ChatGPT, Notion, and Gamma together cover the three jobs a modern report demands - analysis, drafting, and visual presentation - and all three offer free tiers that make report writing AI free a realistic starting point. Our research draws on current vendor documentation, pricing pages, and independent industry studies rather than sponsored placement. AI Productivity may earn a commission from affiliate links on this page; our rankings remain editorially independent.
| Feature | ChatGPT | Notion | Gamma |
|---|---|---|---|
| Best For | Data analysis and narrative writing | Collaborative reports and templates | Visual presentations and slide decks |
| Starting Price | Free (Plus: $20/mo) | Free (Plus: $10/mo) | Free (Plus: $10/mo) |
| Rating | |||
| AI Strength | Advanced data analysis, GPT-5 reasoning | AI agents, workspace-aware summaries | Auto-layout, chart generation, design |
| Output Format | Text, tables, code, charts | Documents, wikis, databases | Slides, web pages, PDFs |
| Collaboration | Shared conversations | Real-time multi-user editing | Shareable links, comments |
| Best Report Type | Analytical deep dives | Recurring team reports | Stakeholder presentations |
How to Create Reports with AI: The Four-Phase Workflow
Creating reports with AI follows four sequential phases: prepare, analyze, draft, and present. This approach works equally well for business analysts and for students using an AI report generator for students or academic research. Once you understand this structured workflow, you will never go back to the old way. Skipping ahead - especially jumping straight to prompting - produces generic output that needs heavy editing. Spending ten minutes on preparation saves thirty minutes of revision.
Phase 1: Prepare Your Data (10 Minutes)
AI tools produce dramatically better reports when you feed them structured input instead of raw chaos. Before opening any tool, organize your source material into three buckets.
Quantitative data should be formatted as tables or structured lists. Instead of burying numbers inside paragraphs, extract them clearly:
Monthly Active Users: 12,400 (up 18% MoM)
Churn Rate: 3.2% (down from 4.1%)
Revenue: $145,000 (up 22% YoY)
Support Tickets: 340 (down 15%)
Qualitative data benefits from pre-categorization. If you have customer feedback, survey responses, or team observations, group them by theme before AI touches them. Five quotes about “slow onboarding” grouped together produce a sharper insight than five random quotes scattered across a prompt.
Context instructions tell the AI who the report is for and what it should accomplish. A single sentence like “This quarterly report is for our board of directors who need to approve next quarter’s hiring budget” shapes every word the AI generates.
Phase 2: Analyze with ChatGPT (15 Minutes)
ChatGPT is the strongest starting point for report creation because its Advanced Data Analysis feature can process spreadsheets, identify patterns, and generate visualizations directly in conversation.
Upload your data file - CSV, Excel, or even a pasted table - and use a structured prompt that defines scope, audience, and desired output:
You are a business analyst preparing a Q4 performance report.

Audience: Executive team (non-technical, focused on ROI)
Purpose: Justify marketing budget increase for Q1
Tone: Professional, data-driven, concise

Using the uploaded data, provide:
1. Executive summary (3-4 sentences, lead with biggest win)
2. Key metrics table with QoQ and YoY comparisons
3. Three actionable insights with supporting data
4. Budget recommendation with projected ROI
The key insight most people miss: ChatGPT performs significantly better when you break complex reports into sequential prompts rather than asking for everything at once. Generate the executive summary first, review it, then prompt for the detailed analysis sections. Each follow-up prompt benefits from the context established in previous responses.
For data-heavy reports, ask ChatGPT to create charts directly. Prompts like “Create a bar chart comparing monthly revenue across all four quarters” produce inline visualizations you can screenshot or export. According to McKinsey’s State of AI report, organizations that pair AI analysis with human interpretation see 40% faster time-to-decision compared to either approach alone.
Pro tip: After generating your analysis, ask ChatGPT to “identify any data points that seem inconsistent or that I should verify before publishing.” This catches calculation errors and anomalies that slip past human review when you’re moving fast.
Phase 3: Draft and Collaborate in Notion (15 Minutes)
Once ChatGPT has produced your analysis and key findings, Notion becomes the ideal environment for turning that analysis into a polished, collaborative document. Notion’s AI features work within your existing workspace context, which means the AI understands your team’s terminology, past reports, and organizational structure.
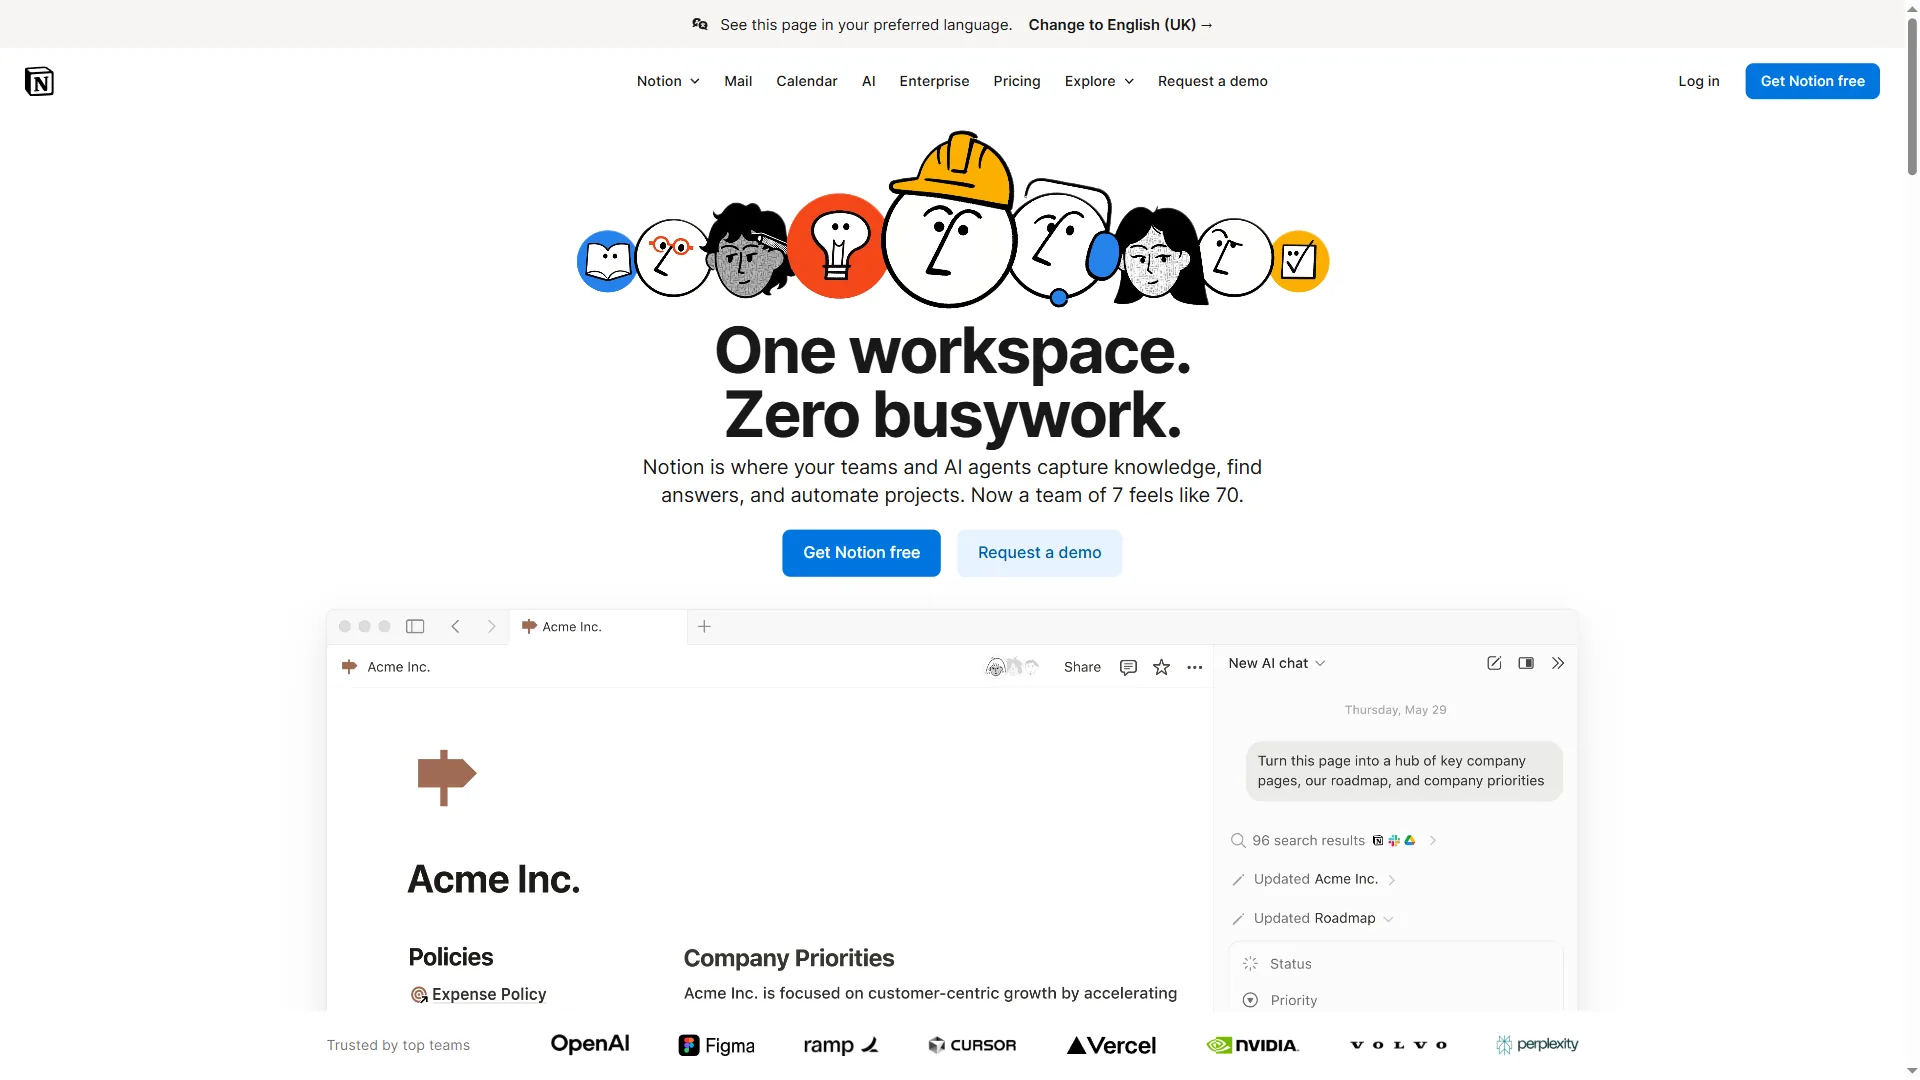
Create a new page from a report template - or build one that your team reuses monthly. Notion databases shine here because you can create a “Reports” database where each entry automatically inherits your standard structure: executive summary, methodology, findings, recommendations, appendix.
Notion AI’s most powerful reporting features include:
- AI Summaries: Highlight any block of pasted data or analysis and ask Notion AI to summarize it for a specific audience. “Summarize this for a non-technical executive” produces different output than “summarize for the engineering team.”
- Tone adjustment: Select any paragraph and shift it from analytical to persuasive, or from detailed to concise, without rewriting from scratch.
- Database integration: Pull live data from connected Notion databases directly into your report. If your team tracks metrics in Notion, the AI can reference those numbers automatically.
The collaborative aspect matters for recurring reports. Multiple team members can contribute sections simultaneously, leave comments on AI-generated drafts, and track versions. This eliminates the “who has the latest version” problem that plagues reports created in standalone documents.
For teams that produce weekly or monthly reports, build a Notion template with embedded prompts. Each section header includes instructions like “AI: Generate a 3-sentence summary of this week’s metrics, highlighting any values that deviate more than 10% from the four-week average.” Team members simply paste their data, trigger the AI, and review - cutting a 90-minute weekly report down to 20 minutes.
Phase 4: Present with Gamma (10 Minutes)
When your report needs to leave your team’s workspace and land in front of stakeholders, clients, or executives, Gamma transforms text-based reports into visually polished presentations without requiring any design skills.
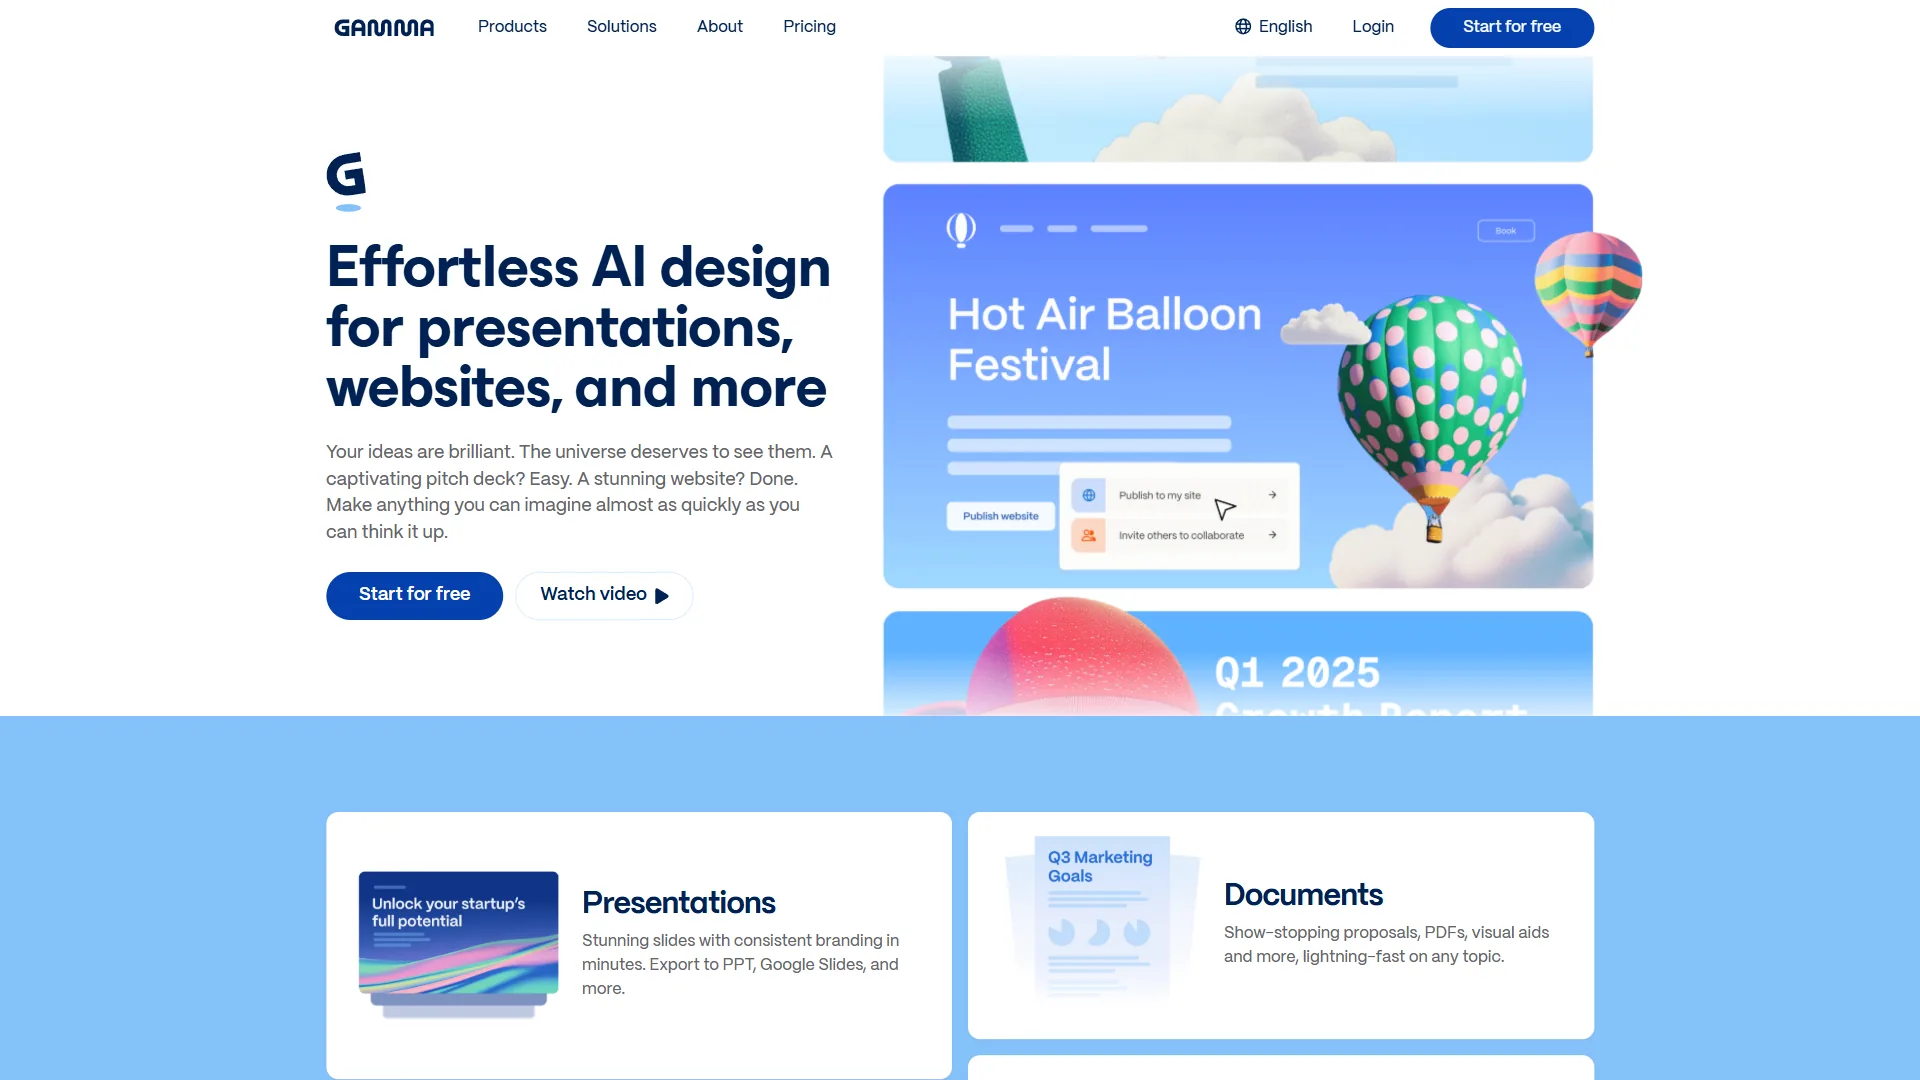
Gamma’s workflow is refreshingly direct: paste your report text (or a summary of it) into the generation prompt, specify the number of slides and visual style, and Gamma produces a complete presentation with automatic layouts, charts, and design elements. The AI Agent feature in Gamma 3.0 even asks clarifying questions to refine the output before generating.
What makes Gamma particularly effective for reports is its handling of data visualization. When your text mentions “revenue grew 34% year-over-year,” Gamma automatically suggests chart types and generates visual representations. You’re not manually creating bar charts in a slide editor - the AI interprets your data context and builds appropriate visuals.
For the best results, structure your Gamma input with clear section breaks and explicit visual instructions:
Create a 10-slide quarterly report presentation.

Slide 1: Title - "Q4 2026 Performance Review"
Slide 2: Executive Summary - [paste your 3-sentence summary]
Slide 3: Revenue Overview - Show bar chart comparing Q1-Q4
Slide 4-6: Key Findings - One finding per slide with supporting data
Slide 7: Customer Metrics - Table format
Slide 8: Competitive Position - Comparison layout
Slide 9: Q1 Recommendations - Numbered list with budget estimates
Slide 10: Next Steps and Timeline
Gamma exports to PowerPoint, Google Slides, and PDF, so the final deliverable works regardless of your stakeholders’ preferred format.
Real Workflow: Monthly Marketing Report in 45 Minutes
A monthly marketing report takes 45 minutes end to end when the four-phase workflow is applied with realistic data. Here is how the complete workflow looks in practice for a marketing team producing a monthly performance report.
Minutes 0-10 (Preparation): Export Google Analytics and CRM data into a spreadsheet. Organize into three tabs: traffic metrics, conversion data, campaign performance. Add a “context” row at the top noting the report’s audience and purpose.
Minutes 10-25 (Analysis in ChatGPT): Upload the spreadsheet and prompt for an executive summary, key metrics comparison, and three actionable recommendations. Ask follow-up questions to deepen the analysis on underperforming channels. Export the chat as a reference document.
Minutes 25-35 (Drafting in Notion): Paste ChatGPT’s analysis into your monthly report template. Use Notion AI to adjust tone for the executive audience, expand the recommendations section, and generate a “methodology” note explaining data sources. Tag team members for review on any sections that need their input.
Minutes 35-45 (Presentation in Gamma): Copy the executive summary and key findings into Gamma. Generate a 8-slide deck for the leadership meeting. Adjust one or two chart types and swap the color scheme to match brand guidelines. Export to PDF and attach to the Notion page for team access.
The same report created manually - with separate data analysis in Excel, writing in Google Docs, formatting in Slides, and multiple rounds of copy-pasting - typically takes 3 to 4 hours. The AI workflow cuts that to under an hour while producing more consistent output.
Avoiding Common Report Creation Mistakes
Four mistakes consistently undermine AI-generated report quality: trusting AI math, using generic prompts, skipping iteration, and ignoring audience context. Even when you know how to create reports with AI, these patterns waste hours of revision time.
“Generative models are powerful drafting partners but unreliable calculators on multi-step financial reasoning,” according to Erik Brynjolfsson, director of the Stanford Digital Economy Lab. That observation matters because the most common AI-report failure mode is silently inherited arithmetic.
Trusting AI math without verification. ChatGPT can calculate percentages and comparisons, but it occasionally makes errors - especially with complex multi-step calculations. Always verify critical numbers against your source data. Stanford HAI’s 2024 AI Index report documents that frontier language models still fail a meaningful share of multi-step numeric problems, which is why finance teams keep a spreadsheet check in the loop.
Using generic prompts. “Write a report about our Q4 performance” yields generic, surface-level output. Specifying audience, purpose, metrics, and format in every prompt produces dramatically better first drafts that need minimal editing.
Skipping the iteration step. The first AI-generated draft is a starting point, not a finished product. Plan for at least one round of “make this more specific” or “cut the filler and focus on actionable insights” prompting. The refinement phase is where AI reports go from adequate to excellent.
Forgetting your audience. A report for your direct team and a report for the board require fundamentally different depth, tone, and emphasis. Set audience context in every prompt - it’s the single highest-impact instruction you can give.
Frequently Asked Questions
Can AI handle confidential data in reports?
AI tools handle confidential report data safely only on enterprise plans that contractually disable training on customer inputs. ChatGPT Enterprise and Team plans offer data privacy guarantees - OpenAI does not train on your inputs. Notion’s enterprise tier includes SOC 2 compliance and data residency controls. For highly sensitive financial or medical data, check each tool’s data processing agreements and consider using on-premise alternatives.
How accurate are AI-generated report narratives?
AI excels at pattern description and trend identification but struggles with causal analysis. If your data shows a 20% revenue increase, AI will accurately describe the increase and compare it to benchmarks. However, it may incorrectly attribute the cause without additional context. Always review causal claims and add your domain expertise to explain “why” behind the “what.”
What’s the best AI tool for financial reports specifically?
For financial reports with complex calculations, start analysis in a spreadsheet tool (Excel or Google Sheets), then use ChatGPT to generate the narrative interpretation. Notion works well for recurring financial reports with standardized templates. Gamma is ideal when financial data needs to be presented to non-financial stakeholders who respond better to visual formats.
How long before AI reporting saves time versus the learning curve?
Most professionals who learn how to create reports with AI break even after two to three reports. The first AI-assisted report may take nearly as long as manual creation because you’re learning prompt patterns and tool workflows. By the third report, you’ll have reusable templates and prompts that compress creation time by 60 to 70 percent. Teams that build shared prompt libraries see even faster adoption.
Can I connect live data sources to these AI tools?
ChatGPT accepts file uploads per conversation. Notion integrates with databases and supports API connections for automated data pipelines. Gamma primarily works with pasted content but can import from Notion pages. For fully automated reporting, tools like Zapier can connect your data sources to Notion, then trigger report generation on a schedule.
The Bottom Line
AI cuts report creation time by 60 to 70 percent without replacing your analytical judgment. Learning how to create reports with AI is not about replacing your analytical thinking - it is about eliminating the mechanical work that sits between your insights and a finished deliverable. The four-phase workflow covered in this guide - prepare in structured format, analyze with ChatGPT, draft collaboratively in Notion, present visually with Gamma - handles the time-consuming translation work while you focus on the strategic judgment that actually matters.
Start with your next recurring report. Pick the one that takes the most time relative to its complexity - usually a weekly update or monthly metrics summary. Run it through the four-phase workflow once, save your prompts as templates, and measure the time difference. Most teams see a 60 to 70 percent reduction in report creation time within the first month, and the gains compound as your template library grows.
The tools are ready. Your data is waiting. The only question is whether you’ll spend another afternoon wrestling with formatting or let AI handle it while you focus on what the data actually means.
Related Reads
These resources extend the workflow above with deeper tool reviews and adjacent reporting use cases. Tools covered in this guide:
- ChatGPT - AI assistant for data analysis, narrative generation, and report drafting
- Notion - All-in-one workspace with AI agents for collaborative report creation
- Gamma - AI-powered presentation tool that turns text into polished visual reports
- Google Sheets - Spreadsheet tool for data preparation and analysis
More reporting and analytics guides:
- AI Presentation Creation Guide - Step-by-step guide to creating presentations with AI tools
- Best AI Analytics Platforms Comparison - Enterprise decision intelligence platforms reviewed
- Notion AI vs Coda AI - Head-to-head comparison of AI-powered workspaces
- AI Hype vs Reality: Why Your CEO is Wrong (But AI Still Wins)
- Best AI Tools for Bookkeepers: Streamline Your Practice in 2026
- Best AI Tools for Data Analysts in 2026
External Resources
These primary sources back the figures and recommendations in this guide and cover adjacent questions such as the 30 percent rule in AI and exporting drafts in Word document format.