




The best data analytics platforms in 2026 are Databricks for ML-native lakehouse workloads, Power BI for Microsoft-shop business intelligence at $14 per user/month, Tableau for visualization-focused analytics at $15 per user/month, and Looker for Google Cloud semantic governance. Each replaces the old data lake versus warehouse divide with unified architectures suited to different team sizes and budgets.
Editorial note: AI Productivity may earn a commission from links on this page; our rankings are editorially independent and based on vendor documentation, published pricing pages, and independent research from Gartner and Forrester, not sponsored placement.
Choosing among the best data analytics platforms 2026 is no longer just about features - it is about matching architecture to workload, from data analytics tools for beginners up to enterprise stacks. The platform landscape has fundamentally shifted: the old divide between data lakes and warehouses has been replaced by unified lakehouse architectures, and even best data analytics platforms for students now expose those same primitives.
The platforms compared here take different approaches: Databricks leads with its ML-native lakehouse, Power BI excels at business intelligence for Microsoft shops, Tableau dominates visualization-focused analytics, and Looker offers a semantic layer approach for Google Cloud organizations. This curated data analytics tools list is narrower than a generic top 10 data analytics tools roundup because four well-matched platforms cover roughly 80% of real buyer intent.
Comparison Table
The Best Data Analytics Platforms include Databricks, Power BI, Tableau and 1 more - a curated data analytics tools list rather than a generic top 10 data analytics tools roundup. Each tool takes a different approach to data analytics platforms, and the right choice depends on your budget, team size, and whether you need data analytics tools for beginners or production-grade governance. This guide compares them on pricing, features, and real performance.
| Platform | Best For | Starting Price | Rating |
|---|---|---|---|
| Databricks | ML/AI workloads, data engineering | Free (Community Edition) | |
| Power BI | Microsoft ecosystem, budget-conscious teams | $0 (Free tier) | |
| Tableau | Visualization excellence, Salesforce integration | $15/user/mo | |
| Looker | Google Cloud native, semantic governance | Custom pricing |
Quick verdict: Databricks wins for unified analytics plus ML, Power BI for affordability and Microsoft integration, Tableau for visualization, Looker for centralized LookML governance.
Databricks: The Lakehouse Platform Leader
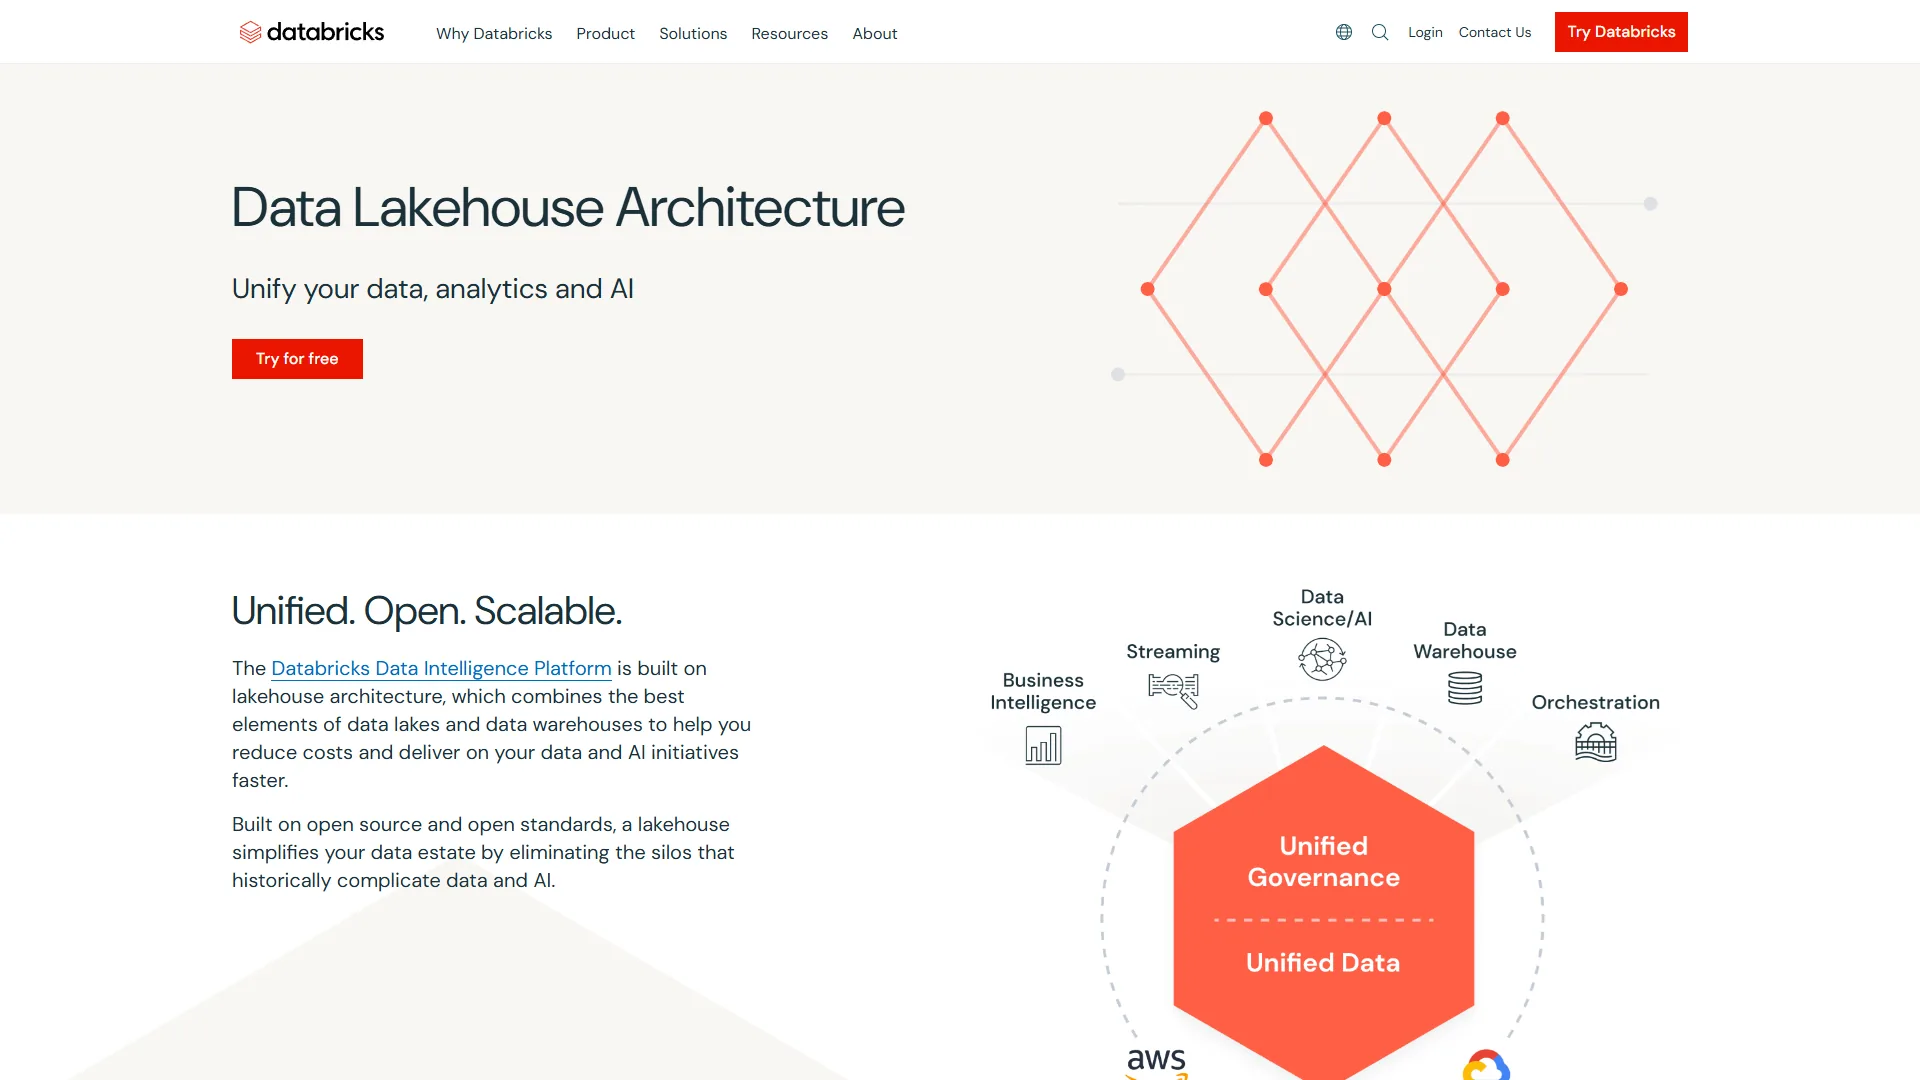
Databricks is the leading lakehouse data platform, unifying data engineering, SQL analytics, and machine learning on one Delta Lake foundation. The lakehouse architecture removes the need to maintain separate data lakes and warehouses - everything runs on Delta Lake with ACID transactions and time-travel capabilities.
Why Databricks Stands Out
Databricks’ strength is unification: data engineering, ML training, and BI run in one environment instead of moving data between systems. The Photon engine delivers up to 12x faster queries than traditional Spark.
Key Features:
- Delta Lake: ACID transactions on data lakes with time travel and schema evolution
- Unity Catalog: Unified governance across AWS, Azure, and Google Cloud
- Serverless Compute: Auto-scaling clusters that eliminate infrastructure management
- Multi-language Notebooks: Python, SQL, Scala, and R support in collaborative notebooks
- MLflow Integration: End-to-end ML lifecycle management built-in
- Agent Bricks: No-code AI agent development on enterprise data (2026 release)
Databricks Pricing Reality
The Community Edition is free forever (introduced 2026), good for learning and proof-of-concept work. Production pricing is per DBU (Databricks Unit) by workload type; Standard tier retired October 2026, so new customers start at Premium. A mid-size data team running mixed workloads typically pays $3,000-8,000/month.
Pricing verified April 2026 from Databricks's pricing page:
- Community Edition (Free Forever): $0/mo (Single node clusters, 15GB RAM)
- Access to full Databricks platform
- Single node clusters
- 15GB RAM limit
- Basic notebooks and collaboration
- Great for learning and small projects
- Forever free tier introduced in 2026
- Best for: Students, individual developers, and proof-of-concept projects
- Standard Tier (Legacy - Being Phased Out): $0/mo (DBU-based annual commitment)
- NOTE: Standard tier retired on AWS/GCP Oct 2026, Azure Oct 2026
- Existing customers automatically upgraded to Premium
- New customers must start with Premium tier
- Basic analytics and data engineering
- Standard support
- Best for: Legacy tier - no longer available for new customers
- Premium Tier (Now Base Level): $0/mo (Up to 37% savings with 1-3 year DBU commitments)
- Role-based access control (RBAC)
- Audit logs and compliance features
- Jobs Compute: $0.15-0.50/DBU per hour
- All-Purpose Compute: $0.40-0.75/DBU per hour
- SQL Compute: $0.22-0.88/DBU per hour
- Unity Catalog governance
- Advanced collaboration tools
- Serverless compute available
- Best for: Standard entry point for production workloads (replaces Standard tier)
- Enterprise Tier: $0/mo (Custom pricing with volume discounts)
- All Premium features
- Enterprise support (24/7)
- Dedicated infrastructure options
- Advanced security and compliance
- Priority support with custom SLAs
- Multi-cloud deployment (AWS, Azure, GCP)
- Advanced Unity Catalog features (ABAC, tag policies)
- Service credentials for external integrations
- Best for: Large enterprises with complex data and AI requirements at scale
ROI Data That Matters
The numbers here are impressive: Forrester found 417% ROI over three years, while Nucleus Research reported 482% ROI. In practical terms, teams report 70% reduction in data pipeline development time and 40% faster ML model deployment compared to DIY Spark clusters.
Databricks Limitations and Who It’s Not For
Skip Databricks if your team lacks dedicated data engineering bandwidth - the platform’s flexibility comes with operational complexity that overwhelms small teams. The DBU-based pricing model is hard to forecast without an FinOps practice, and Premium-tier minimums (around $3,000/month) make it overkill for ad-hoc analytics on under 1TB of data. Power BI or Looker fits better for pure dashboarding workloads.
Power BI: Best for Budget-Conscious Teams
Power BI is Microsoft’s enterprise BI platform, with a functional free tier (unlike many “freemium” offerings) and a $14 per user/month Pro tier - the most affordable option for small-to-medium teams.
When Power BI Makes Sense
If your organization runs on Microsoft 365, Power BI is the obvious choice - it pulls cleanly from Excel, SharePoint, Teams, Dynamics 365, and Azure without complex configuration. The Copilot AI assistant (Premium capacity required) generates DAX formulas and suggests visualizations from natural-language queries.
Key Features:
- Copilot AI: Natural language query and dashboard generation (Premium/Fabric only)
- Microsoft Ecosystem: Native integration with all Microsoft services
- Paginated Reports: PDF-ready formatted reports (Premium Per User)
- Dataflows: Self-service ETL for business users
- Real-time Dashboards: Live data streaming with 8 refreshes/day (Pro tier)
Power BI Limitations
Power BI is not a data-engineering platform - complex pipelines, large-scale ML training, and streaming transformations need additional tools. It excels at the “last mile”: taking prepared data and making it accessible to business users. Copilot AI also has a steep entry requirement (Fabric F64+ or Premium P1+, around $5,000/month) that prices out small organizations.
Power BI Pricing Tiers
Pricing verified April 2026 from Power BI's pricing page:
- Power BI Free: $0/mo (Personal use only, limited sharing, no collaboration features)
- Power BI Desktop (unlimited)
- Personal data visualization
- Connect to 100+ data sources
- Create reports and dashboards
- Publish to personal workspace
- Best for: Personal analysis and learning
- Power BI Pro: $14/user/mo (Up to 10GB storage per user, 8 daily refreshes)
- All Free features
- Share reports and dashboards
- Team collaboration
- Scheduled refresh (8x daily)
- Real-time dashboards
- Microsoft 365 integration
- Export to PowerPoint/PDF
- Row-level security
- Best for: Small to medium teams needing collaboration
- Power BI Premium Per User (PPU): $24/user/mo (100GB storage per user, 48 daily refreshes)
- All Pro features
- Advanced analytics
- Paginated reports
- Deployment pipelines
- Large dataset support (100GB)
- More frequent refresh (48x daily)
- Advanced AI visualization
- Incremental refresh
- Dataflows
- XMLA endpoint access
- Note: Copilot requires Fabric F64+ or Premium P1+ capacity
- Best for: Power users needing advanced analytics and large datasets
- Power BI Premium Per Capacity: Contact sales (Starts at P1 SKU, unlimited users)
- All PPU features
- Unlimited users in organization
- Copilot AI (requires P1+ SKU minimum)
- Enterprise-grade capacity
- Multi-geo deployment
- Larger dataset sizes (400GB+)
- Higher refresh frequencies
- Dedicated capacity resources
- XMLA endpoint read/write
- Bring your own key (BYOK)
- Autoscale add-on available
- Best for: Large enterprises requiring Copilot AI and unlimited users
Tableau: Visualization Excellence
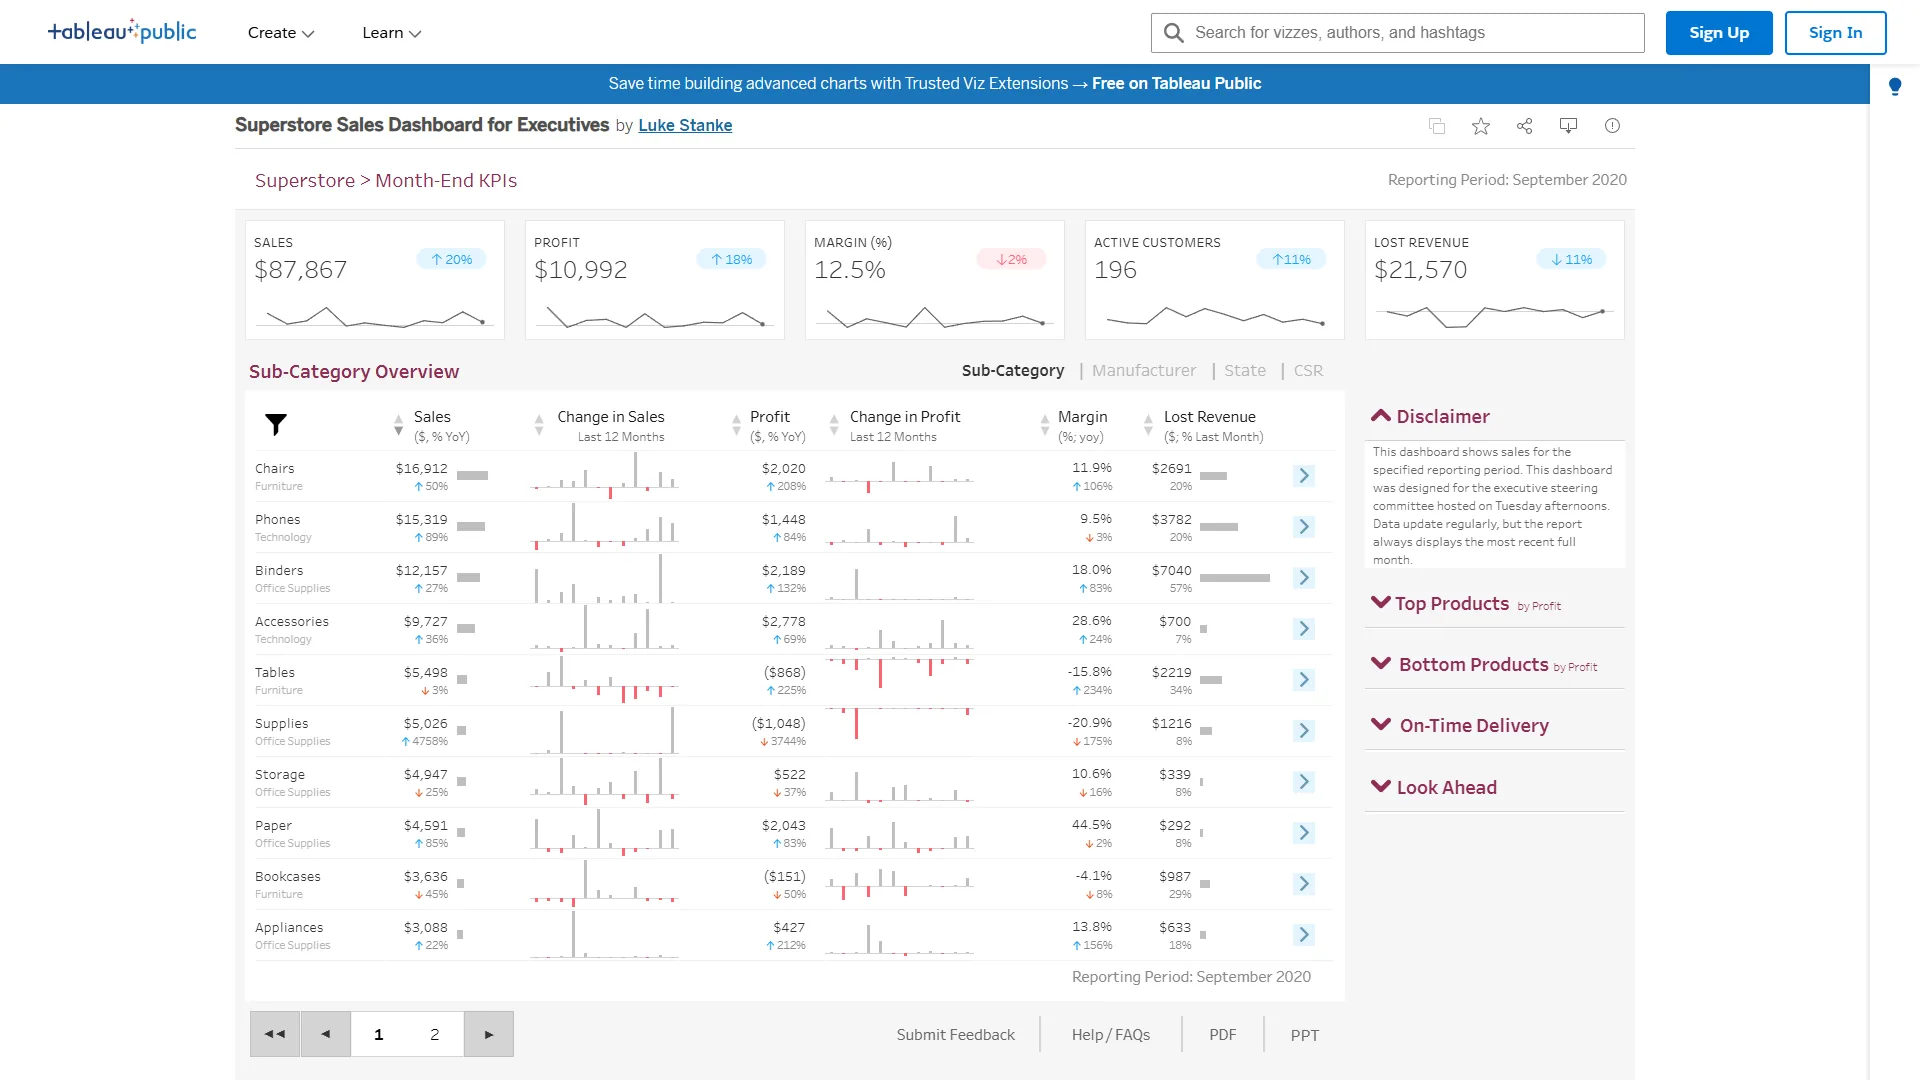
Tableau is the gold standard for data visualization: the drag-and-drop interface makes complex charts accessible, and the Tableau Agent (Tableau+ subscription) brings AI-powered insights to Explorer and Creator users.
Tableau’s Visualization Edge
Rebuilding the same dashboard across all four platforms makes Tableau’s visual edge obvious: default styling is more polished, interactivity is more intuitive, and no-code customization far exceeds competitors - the official Tableau dashboard best practices guide shows how granular the formatting controls go. This matters most for executive or customer-facing work.
Key Features:
- Tableau Agent: AI assistant for conversational analytics (requires Tableau+ subscription)
- Tableau Pulse: Automated insights delivered to Slack/Teams
- Dashboard Starters: Pre-built templates for common use cases
- Prep Builder: Visual data preparation tool included with Explorer/Creator licenses
- Salesforce Integration: Deep integration with Salesforce CRM ecosystem
Tableau Limitations and Who It’s Not For
The learning curve is steeper than Power BI and the cost is significantly higher: Tableau Creator (required for authoring) starts at $75/month Standard or $115/month Enterprise. A 50-person team with 10 creators, 20 explorers, and 20 viewers costs about $4,400/month on Enterprise. Tableau is also not a data-engineering platform - it is purely a BI layer that assumes prepared data; ETL pipelines and ML training need complementary tools.
Tableau Pricing Structure
Pricing verified April 2026 from Tableau's pricing page:
- Viewer (Standard): $15/user/mo (View-only access, no editing)
- View and interact with dashboards
- Download summary data
- Data-driven alerts
- Mobile access
- Best for: Read-only consumers of dashboards
- Explorer (Standard): $42/user/mo (Edit existing content, limited authoring)
- Explore and edit existing workbooks
- Download full data
- Manage users and content
- Create basic visualizations
- Tableau Prep Builder
- Tableau Pulse
- Tableau Agent access (with Tableau+ subscription)
- Best for: Analysts editing existing content
- Creator (Standard): $75/user/mo (Full authoring capabilities, required for deployment)
- Create new workbooks and data flows
- Full Tableau Desktop access
- Tableau Prep Builder
- Tableau Pulse
- Tableau Agent access (with Tableau+ subscription)
- Dashboard Starters
- Export and curate data sources
- Monitor flow performance
- Up to 3 sites
- Best for: Authors building new dashboards and data flows
- Viewer (Enterprise): $35/user/mo (Enterprise-grade security and governance)
- All Viewer Standard features
- Advanced Management
- Data Management
- eLearning access
- Up to 10 sites
- Tableau Pulse
- Best for: Enterprise read-only users with governance needs
- Explorer (Enterprise): $70/user/mo (Enterprise features with editing capabilities)
- All Explorer Standard features
- Advanced Management
- Data Management
- eLearning access
- Up to 10 sites
- Enhanced governance
- Tableau Pulse
- Tableau Agent access (with Tableau+ subscription)
- Best for: Enterprise analysts with editing needs
- Creator (Enterprise): $115/user/mo (Full enterprise capabilities)
- All Creator Standard features
- Advanced Management
- Data Management
- eLearning platform
- Up to 10 sites
- Enterprise-grade security
- Advanced governance tools
- Priority support
- Tableau Agent access (with Tableau+ subscription)
- Best for: Enterprise authors with governance and security requirements
Enterprise adds advanced governance, up to 10 sites, and priority support - essential for large organizations with compliance requirements.
What Makes Looker’s Semantic Layer an Advantage?
Looker’s semantic layer is an advantage because it forces every dashboard, report, and API call to share one governed metric definition written in LookML, rather than letting each team query raw tables and re-invent “revenue” or “active user”. Instead of connecting directly to data sources, Looker compiles queries from a semantic layer in LookML that standardizes metrics across your organization, which Google reports reduces gen AI query errors by 66%.
What Makes the LookML Difference?
LookML is both Looker’s strength and its learning curve: metrics defined once in code propagate to every dashboard, report, and API call. When “revenue” means different things in different departments, LookML enforces one definition - critical governance at scale. The Gemini AI integration (late 2026) brings conversational analytics, code interpretation, and slide generation to non-technical users without sacrificing that governance.
Key Features:
- LookML Semantic Layer: Centralized metric definitions reduce errors by 66%
- Gemini AI: Conversational analytics with code interpreter (general availability)
- Google Cloud Native: Optimized for BigQuery and Google Cloud Platform
- Embedded Analytics: White-label embedding for customer-facing dashboards
- Version Control: Git-based workflow for data models
Looker’s Cost Reality
There is no self-service pricing - everything routes through enterprise sales. Publicly disclosed deals put Standard Edition at $150-200/user/month, with total cost of ownership reaching $200,000-300,000/year for mid-market deployments once BigQuery and implementation services are included. That positions Looker as enterprise-only; startups and small businesses will find the sales-qualification process alone frustrating.
Looker Limitations and Who It’s Not For
Skip Looker if you’re not on Google Cloud / BigQuery (the platform is heavily optimized for that stack and noticeably slower with non-Google warehouses), if your team doesn’t include at least one engineer comfortable with LookML version control, or if you need predictable per-seat pricing under $100 per user. Power BI fits Microsoft shops better; Tableau fits visualization-first teams.
Which Data Analytics Platform Fits Your Team?
The right data analytics platform depends on three variables: your existing cloud, your team’s engineering depth, and your per-user budget - Databricks fits ML-heavy teams on any cloud, Power BI fits Microsoft shops under $20 per user, Tableau fits visualization-first teams, and Looker fits Google Cloud organizations needing governed metrics. The decision matrix below maps each profile to its match.
Choose Databricks If:
- You need unified data engineering + ML + analytics
- You’re building ML models that require training on large datasets
- You want lakehouse architecture with ACID transactions on data lakes
- You need multi-cloud deployment (AWS, Azure, GCP)
- Your team has data engineering expertise
- You can justify DBU-based pricing with ROI (417%+ over 3 years)
Real-world example: A fintech startup cut data-pipeline development time by 70% after consolidating five tools (Airflow, Spark, MLflow, Jupyter, a proprietary feature store) onto Databricks.
Choose Power BI If:
- You’re already invested in Microsoft 365/Azure
- You need the most affordable option ($14 per user/month)
- Your users are business analysts, not data engineers
- You want rapid deployment without extensive training
- You need strong Excel integration
- Budget is a primary constraint
Real-world example: A 200-person manufacturer deployed Power BI Pro for $2,800/month; the same scope on Tableau Enterprise would cost $14,000/month.
Choose Tableau If:
- Visualization quality is your top priority
- You’re presenting to executives or external stakeholders
- You have budget for premium pricing ($115 per user/month Enterprise)
- Your team values best-in-class UI/UX
- You’re already in the Salesforce ecosystem
- You need the Tableau Agent AI assistant for insights
Real-world example: A consulting firm uses Tableau for all client-facing dashboards; after testing Power BI, clients consistently called Tableau’s output “more professional.”
Choose Looker If:
- You’re all-in on Google Cloud Platform and BigQuery
- You need centralized semantic governance at enterprise scale
- You have developers who can maintain LookML code
- You’re embedding analytics in customer-facing applications
- You can afford $150-200/user/month + BigQuery costs
- Reducing metric inconsistency is a critical pain point
Real-world example: A SaaS company with 50+ customers uses Looker’s embedded analytics for white-labeled dashboards; LookML ensures every customer sees identically calculated metrics.
ROI Calculator Across Platforms
The four data analytics platforms deliver measurably different returns over three years: Databricks leads at 417-482% ROI, Tableau at 319%, and Power BI at 265%, based on independent Total Economic Impact studies from Forrester and Nucleus Research plus disclosed customer case studies. “Organizations adopting lakehouse architecture report a 417% three-year ROI and roughly $7.2 million in net present value,” according to Forrester’s Total Economic Impact study commissioned by Databricks.
Databricks:
- 417-482% ROI over 3 years
- 70% reduction in data pipeline development time
- 40% faster ML model deployment
- $7.2M net present value for reference customer (Forrester)
Power BI:
- 265% ROI over 3 years (Forrester)
- Average payback period: 6 months
- 30% reduction in report creation time
- Best ROI for SMB due to low entry cost
Tableau:
- 319% ROI over 3 years (Nucleus Research)
- $5.4M total benefit over 3 years
- Average time savings: 3-4 hours per analyst per week
- Higher upfront cost but strong returns at scale
Looker:
- Limited public ROI data (most deals are confidential)
- Customers report 50% reduction in metric inconsistency
- Embedding use cases show 2-3x faster customer dashboard deployment
- Higher TCO but justified by governance benefits
FAQ: Best Data Analytics Platforms 2026
Q: Can I use Databricks for business intelligence, or is it just for data engineering?
Yes, Databricks has full BI capabilities through SQL warehouses and Databricks SQL. You can build dashboards, run ad-hoc queries, and connect BI tools like Tableau or Power BI. The difference is that you’re also getting the data engineering and ML platform in the same environment.
Q: Is Power BI really free, or is that just marketing?
The Power BI Free tier is genuinely functional - you get full desktop authoring and personal workspaces. The limitation is sharing: you can’t collaborate with teammates or publish to the web. For production use with sharing, you need Pro ($14 per user/month). The “free” tier is best for personal analysis or learning.
Q: Why is Tableau so expensive compared to Power BI?
Tableau’s pricing reflects its positioning as a premium visualization platform. You’re paying for best-in-class UI/UX, superior visual design, and a more polished end-user experience. For organizations where dashboard aesthetics matter (consulting firms, executive presentations), the premium is justified. Budget-conscious teams should start with Power BI.
Q: Do I need to know LookML to use Looker?
Not as an end user - business users interact with pre-built Explores and dashboards without touching code. However, someone on your team needs LookML expertise to build and maintain the semantic layer. This is typically a data engineer or analytics engineer role. The tradeoff: higher initial investment for long-term governance benefits.
Q: Can these platforms handle real-time data?
Yes, but with different approaches. Databricks handles true streaming with Delta Live Tables and Structured Streaming. Power BI supports real-time dashboards with DirectQuery and streaming datasets (8-48 refreshes/day depending on tier). Tableau can connect to live data sources but is not optimized for sub-second latency. Looker queries data warehouses in real-time but depends on warehouse performance.
Q: Will AI replace data analysts on these platforms?
No, AI features in these data analysis tools augment analysts rather than replace them. Databricks Genie, Power BI Copilot, Tableau Agent, and Looker Gemini automate SQL generation and chart drafting, but interpreting results, validating data quality, and translating findings into business decisions still require human judgment - the same conclusion the U.S. Bureau of Labor Statistics 2026 outlook reaches for analyst roles.
Q: What are the 5 big data analytics categories these platforms cover?
The 5 big data analytics categories - descriptive, diagnostic, predictive, prescriptive, and real-time streaming - are all covered by Databricks; Power BI and Tableau cover descriptive and diagnostic well, predictive via integrations; Looker focuses on descriptive and diagnostic on top of a governed warehouse. For best open source analytics tools as complements, Apache Superset and Metabase pair cleanly with all four.
Final Verdict: The Best Data Analytics Platform for Most Organizations
The recommendation hierarchy is straightforward:
For most organizations with ML/AI needs: Databricks. The lakehouse architecture is the future, and the 417% ROI over three years speaks for itself. Yes, DBU-based pricing is complex, but the unified platform eliminates the cost of maintaining separate data lakes, warehouses, and ML infrastructure. Start with the free Community Edition to validate your use case, then scale to Premium tier when you’re ready for production.
For Microsoft-centric organizations on a budget: Power BI. At $14 per user/month for Pro, it’s unbeatable value. The Copilot AI features require premium capacity, but the core BI functionality is excellent for the price. If you live in Excel and Teams, Power BI is the obvious choice.
For visualization-first organizations: Tableau. If you’re presenting to executives, clients, or board members, Tableau’s visual polish justifies the premium pricing. The Tableau Agent AI assistant (with Tableau+ subscription) is also genuinely useful for accelerating analysis.
For Google Cloud + governance-first organizations: Looker. The LookML semantic layer is the most robust governance approach in this comparison. If metric consistency is a critical pain point and you’re willing to invest in the learning curve, Looker pays dividends at enterprise scale.
The best data analytics platforms 2026 are not one-size-fits-all - the best platform for data analysis depends on which cloud you live in, how much engineering depth your team has, and whether per-user budgets are above or below $20. Match your choice to workload, ecosystem, budget, and team expertise. Start with a proof-of-concept on the free tiers (Databricks Community Edition, Power BI Free) before committing to paid licenses.
Related Reading
The four tools covered in this guide each have dedicated reviews, and three further AI Productivity guides extend the data analytics tools list into adjacent workflows:
- Databricks - Unified lakehouse platform for data engineering and ML
- Power BI - Microsoft business intelligence for budget-conscious teams
- Tableau - Visual analytics with best-in-class dashboards
- Looker - Google Cloud semantic layer for data governance
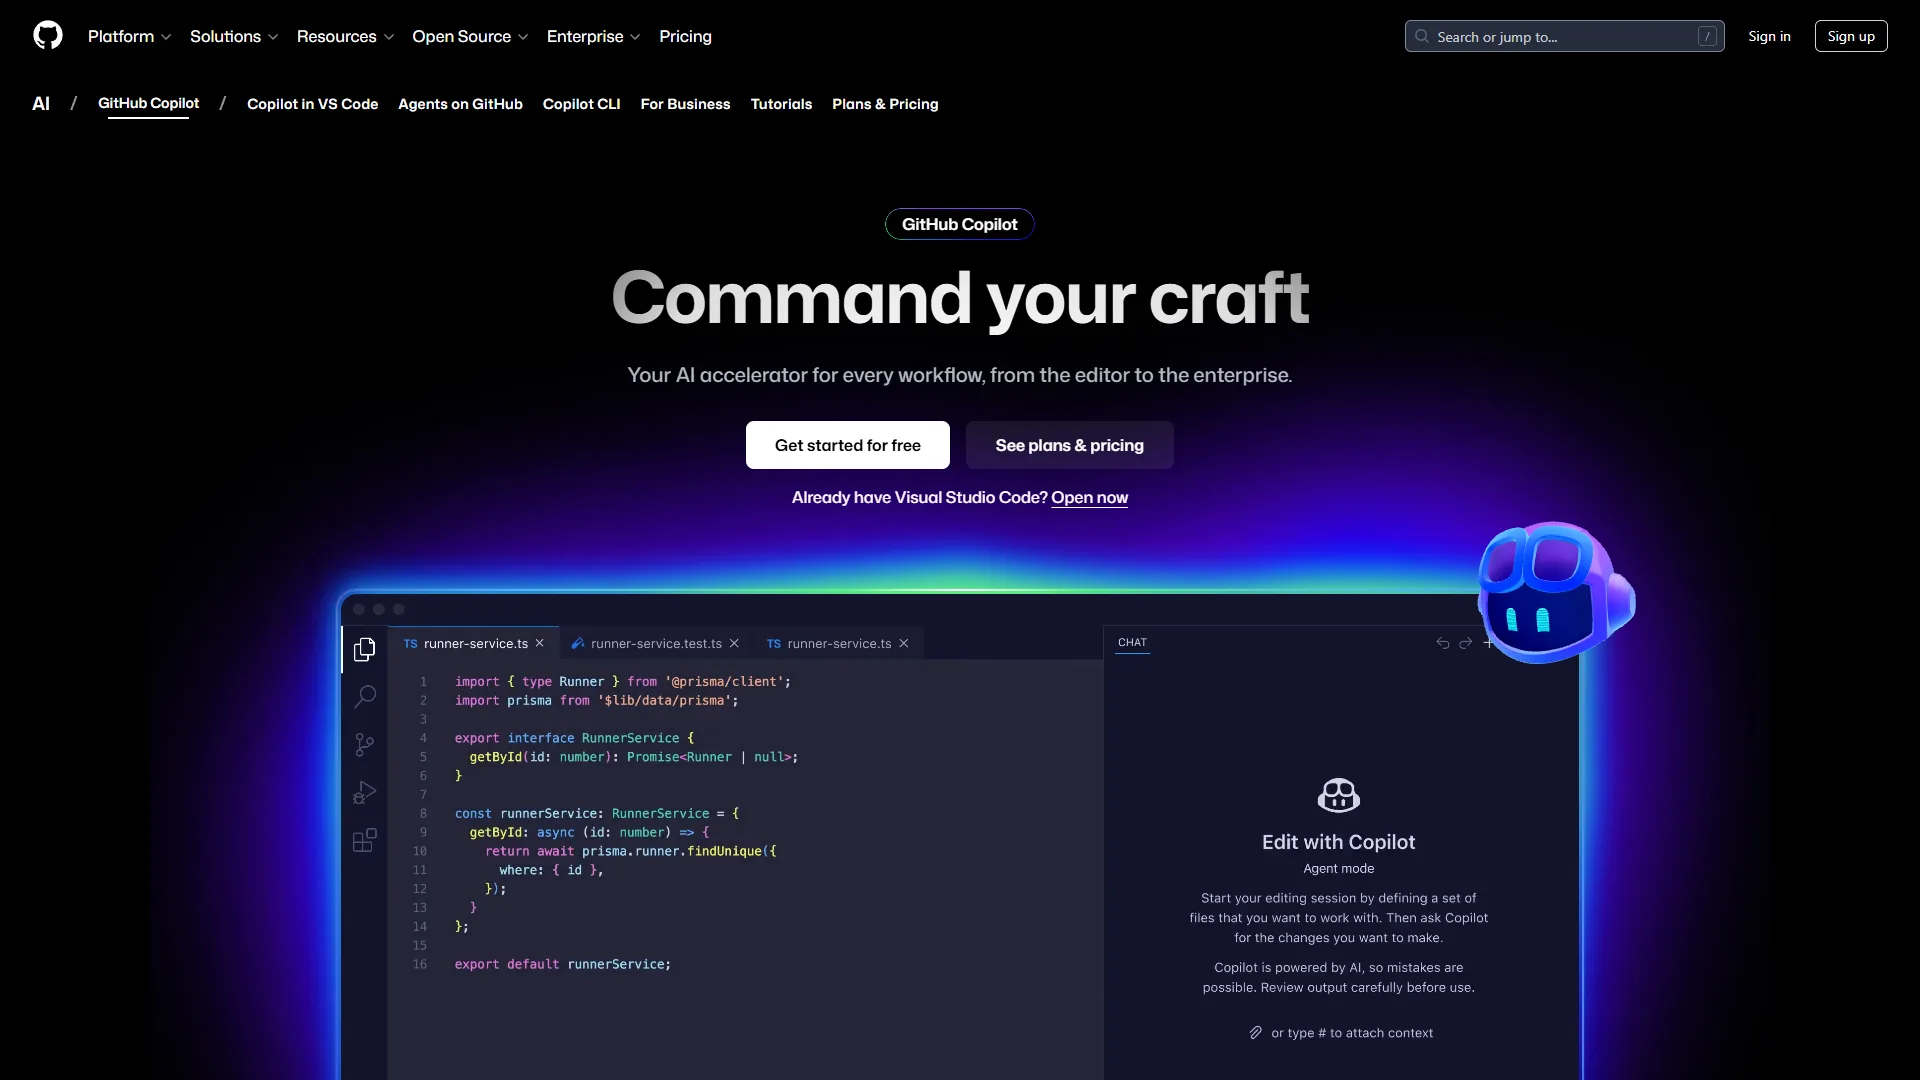
- GitHub Copilot - AI coding assistant for data pipeline development
More analytics and data guides:
- Best AI Research Tools 2026 - Compare AI-powered research platforms
- Best AI Automation Tools 2026 - Automate data pipeline workflows
- Best Project Management Tools 2026 - Manage analytics projects effectively
External Resources
The following primary sources document the platforms, architectures, and best practices referenced throughout this comparison: