






Looker vs Power BI is one of the most consequential BI decisions organizations make in 2026 - both platforms deliver business intelligence at scale through fundamentally different philosophies, organizational profiles, and price tags.
Power BI is Microsoft’s self-service analytics platform: affordable, deeply integrated with Microsoft 365, and accessible enough for non-technical users to build dashboards. Looker is Google Cloud’s enterprise-grade BI platform: built around LookML data modeling, designed for centralized governance at scale, and priced accordingly. For a wider lens, our best business intelligence tools 2026 shortlist groups every major contender by use case.
According to Microsoft’s Power BI implementation guidance, organizations following structured BI plans see 2-3x faster adoption, Google’s Looker documentation emphasizes the value of a centralized semantic layer, and Gartner’s BI research finds poor platform selection is the leading cause of BI project failure within 18 months.
According to Amir Netz, Technical Fellow at Microsoft, “Power BI was built around the premise that business users themselves should be empowered to model, analyze, and share their data without waiting on IT.”
Our analysis draws on each vendor’s current pricing pages, technical documentation, and independent BI research rather than sponsored placement. AI Productivity may earn a commission from links on this page; rankings remain editorially independent. The comparison covers data modeling, governance, pricing reality, scalability, and the workflows each tool genuinely supports.
Comparison Table: Looker vs Power BI
Power BI costs $10 to $20 per user each month for self-service analytics, while Looker runs $5,000 to $10,000-plus per month for enterprise governance and embedded analytics. The table below compares the two across pricing, modeling, deployment, and integration depth.
| Category | Power BI | Looker |
|---|---|---|
| Core identity | Self-service BI for Microsoft ecosystems | Enterprise data modeling and governance platform |
| Best for | Microsoft shops, self-service analytics, affordable BI | Large data orgs, LookML governance, embedded analytics |
| Pricing | Free (Desktop), $10/user/mo (Pro), $20/user/mo (Premium Per User) | Enterprise contact-sales (typically $5,000-$10,000+/mo) |
| Data modeling | DAX + Power Query | LookML (SQL-based semantic layer) |
| Deployment | Cloud (Power BI Service) + Desktop | Cloud (Google Cloud) |
| Learning curve | Moderate (DAX is complex) | Steep (LookML requires SQL knowledge) |
| Embedded analytics | Limited | Strong (core use case) |
| Google Cloud integration | Limited | Native |
| Microsoft 365 integration | Native | Limited |
| Rating |
Short version: Choose Power BI for affordable, Microsoft-integrated self-service analytics. Choose Looker for centralized data governance, LookML semantic modeling, or embedded analytics in customer products.
Power BI: Self-Service BI for the Microsoft Ecosystem
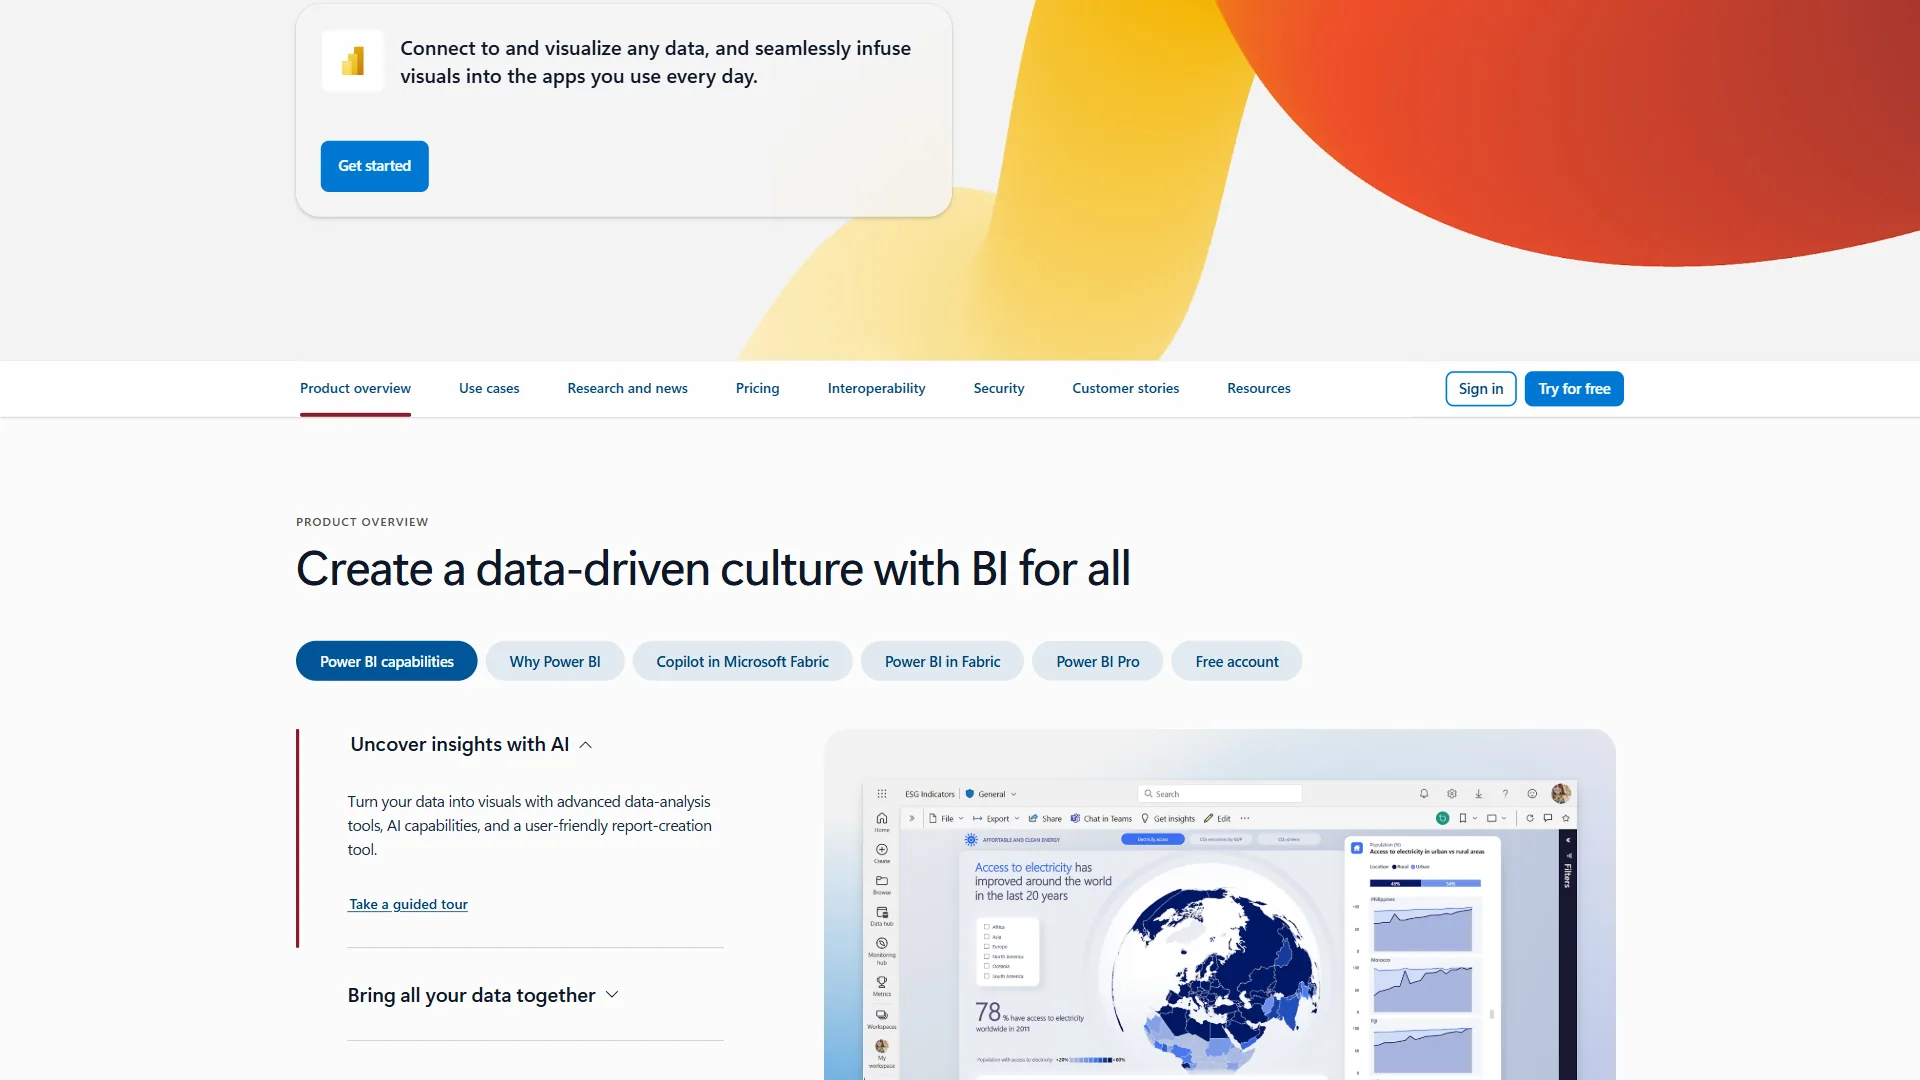
Power BI launched in 2015 and is now the dominant self-service BI platform globally on the strength of its pricing and Microsoft 365 integration. The Desktop app is free, Power BI Pro runs $10 per user per month, and Premium Per User costs $20 per month - and for organizations on Microsoft enterprise agreements, Power BI often comes bundled or at steep discount.
That pricing story is difficult to argue against when organizations already live in Excel, SharePoint, and Teams.
Where Power BI excels:
- Microsoft 365 integration. Publish reports to Teams, embed them in SharePoint, and connect natively to Excel, Azure SQL, and Dynamics 365 - integration depth is unmatched for Microsoft-first organizations.
- DirectQuery and Import modes. Import data into Power BI’s in-memory engine for fast performance, or use DirectQuery for live connections to source systems.
- DAX (Data Analysis Expressions). Analysts familiar with Excel formulas pick up basic DAX quickly, and the ceiling is high enough for complex calculated measures and time intelligence functions.
- Copilot integration. Microsoft’s Copilot for Power BI brings natural language queries to the platform - a meaningful UX improvement for non-technical stakeholders.
- Report publishing and sharing. The Power BI Service handles publishing, dashboard sharing, refresh schedules, and access permissions at scale.
- Affordable gateway to enterprise BI. Organizations with no formal BI infrastructure get a path from Excel chaos to structured reporting without a six-figure implementation budget.
Where Power BI falls short:
- Data governance at scale. Multiple teams build conflicting definitions of the same metrics, producing “multiple versions of truth” across departments.
- DAX complexity. Time intelligence, rolling averages, and row vs. filter context trip up even experienced analysts.
- Embedded analytics limitations. Embedding Power BI externally requires Premium capacity starting at $4,995 per month - narrowing the pricing advantage over Looker.
- Version control and CI/CD. Git integration is improving but still lags Looker’s code-based workflows.
Looker: Enterprise Data Modeling and Governance
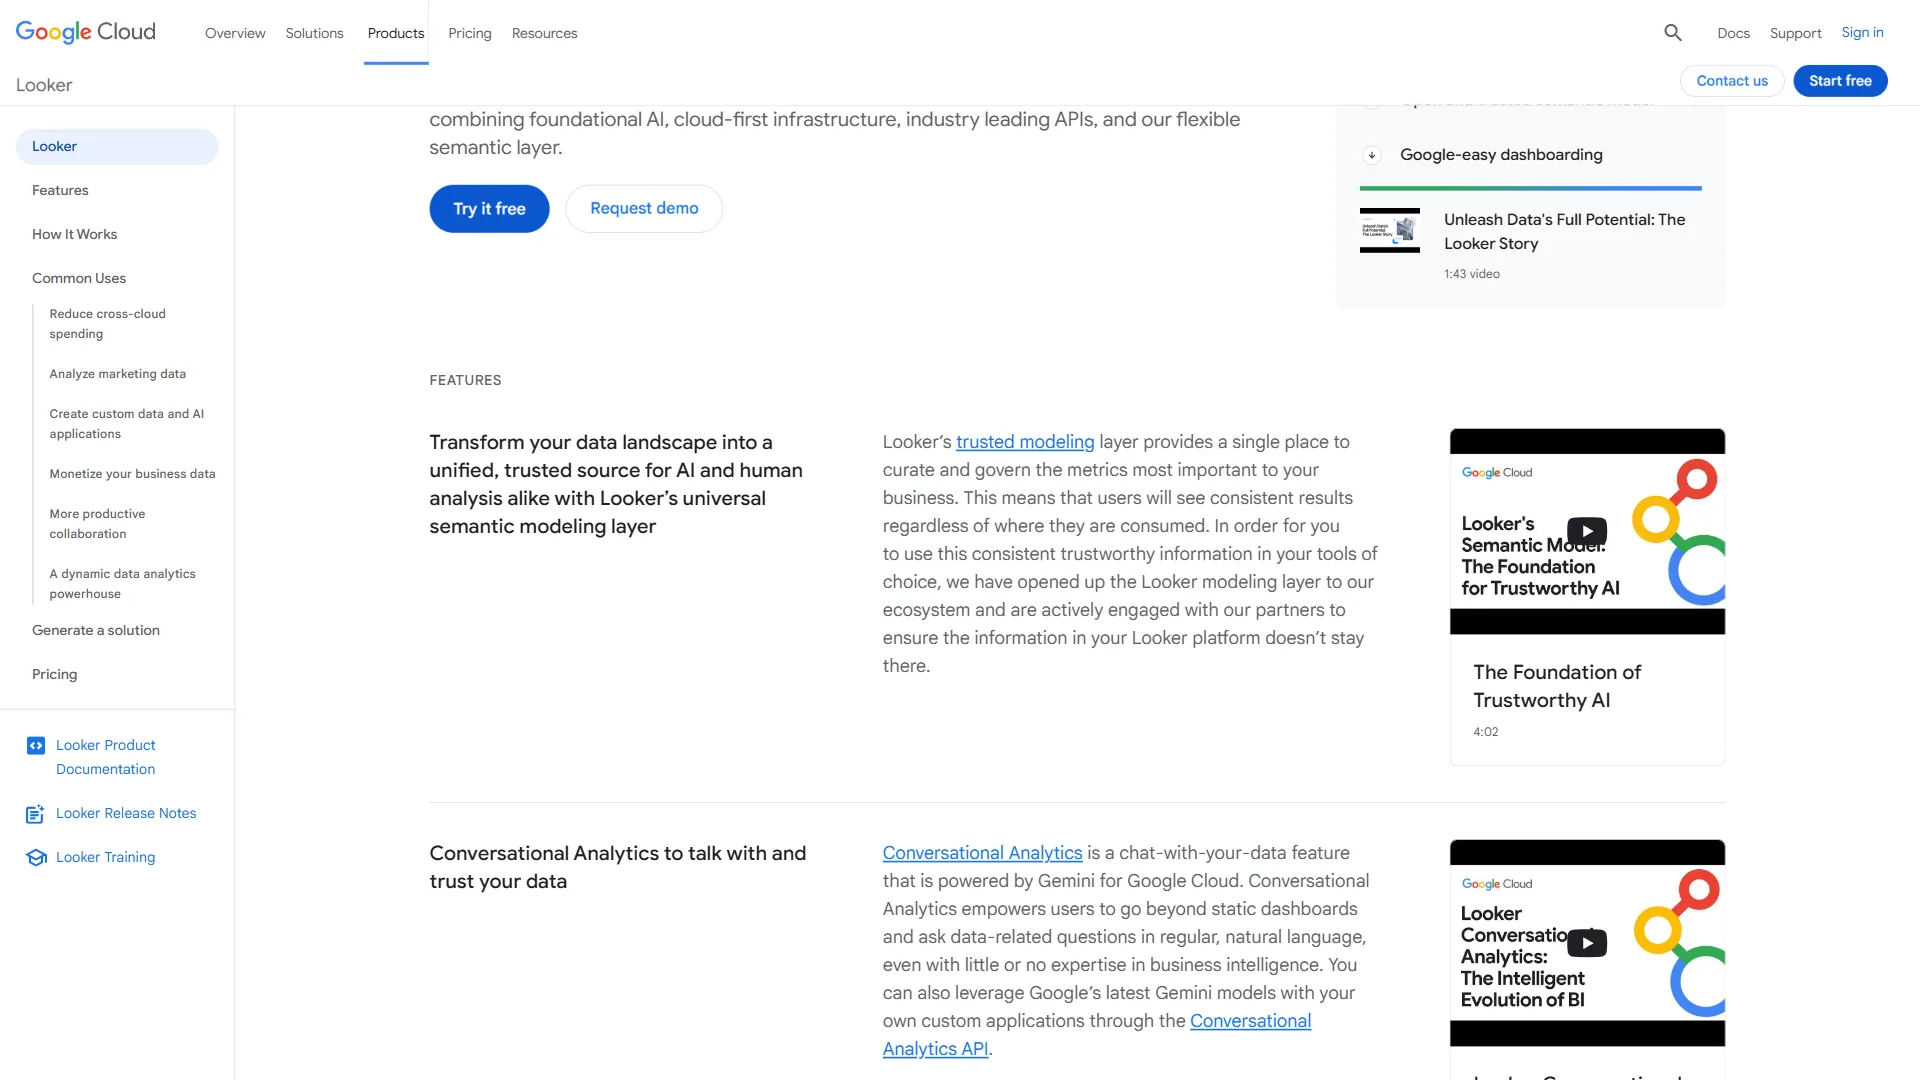
Looker was acquired by Google in 2020 and is now a core part of Google Cloud, built around a single architectural choice that distinguishes it from every other BI tool: LookML.
LookML (Looker Modeling Language) is a SQL-based semantic layer where data teams define dimensions, measures, relationships, and business logic in code. These definitions become the authoritative source of truth for every report and dashboard, so a business user, the CFO, and a customer-facing dashboard all see the same “Monthly Recurring Revenue” number - one version of truth, enforced by the model.
Where Looker excels:
- Data governance through LookML. The semantic layer enforces consistent metric definitions across every team and every tool - Looker’s core value proposition for large data organizations.
- Embedded analytics. Looker is built for embedding, with granular access controls and white-labeling for customer-facing products and third-party tools.
- LookML version control. LookML files live in Git, enabling full version control, code review, and CI/CD pipelines for data model changes.
- SQL flexibility. Everything in Looker ultimately generates SQL - analysts can extend LookML with custom SQL, write raw SQL when needed, and inspect the generated SQL for any query.
- Multi-database support. Looker connects to BigQuery, Snowflake, Redshift, Databricks, PostgreSQL, and dozens of other databases without moving data.
- Google Cloud integration. Native connections to BigQuery, Vertex AI, and Looker Studio make Looker the natural BI layer for Google Cloud-first organizations.
Where Looker falls short:
- Price. Enterprise pricing typically runs $5,000 to $10,000-plus per month, with no self-service tier - you contact sales.
- Implementation complexity. Deploying Looker requires data engineering resources to build and maintain LookML models; organizations without dedicated data teams will struggle.
- Self-service limitations. Business users work inside the Explore interface, constrained by what the LookML model exposes - data teams control what users can see.
- Visualization breadth. Looker’s native visualizations are more limited than Power BI’s chart library; complex custom charts often require external tools.
- No free tier. There is no desktop application, no free tier, and no self-service trial.
How Do DAX and LookML Compare for Data Modeling?
DAX is Power BI’s in-file formula language for analyst-driven calculated measures, while LookML is Looker’s Git-versioned semantic layer that data engineers define once for the entire organization. The two approaches diverge most sharply at this layer, which drives the rest of the platform comparison.
Power BI’s DAX Approach
Power BI uses DAX (Data Analysis Expressions) for calculated measures and Power Query (M) for data transformation inside its tabular data model. The distinction between row context and filter context - the basis for how DAX formulas evaluate - is notoriously difficult, and time intelligence plus many-to-many relationships demand deep understanding of both.
The upside: DAX lives in the .pbix file, so analysts extend the model without data engineering. The downside: multiple analysts editing the same dataset create inconsistency that certified datasets only partially address.
Looker’s LookML Approach
LookML takes a different position. Data engineers define dimensions, measures, and the underlying SQL in code; business users access those concepts in the Explore interface without writing SQL. When “active customer” changes, you update it once in LookML and it propagates everywhere.
The tradeoff: LookML requires SQL expertise to write and maintain, and business users cannot extend the model. For mature data teams that is a feature; without dedicated data engineering, it is a barrier.
For enterprise data governance, Looker’s LookML is architecturally superior. For self-service flexibility without data engineering, Power BI’s DAX is more accessible.
Total Cost: How Much Does Looker vs Power BI Actually Cost?
Power BI costs $10 per user per month on Pro and $20 per user per month on Premium Per User, while Looker contracts typically run $5,000 to $10,000-plus per month with no public pricing tier - one of the largest pricing gaps in the BI market.
Power BI Pricing
| Plan | Price | Key Features |
|---|---|---|
| Power BI Desktop | Free | Local report authoring, no sharing |
| Power BI Pro | $10/user/mo | Sharing, collaboration, cloud publishing |
| Premium Per User (PPU) | $20/user/mo | AI features, advanced analytics, paginated reports |
| Premium Capacity | From $4,995/mo | Embedded analytics, unlimited content viewers |
A 50-person organization on Power BI Pro pays $500 per month, or $1,000 per month on Premium Per User - manageable total cost for most organizations.
Looker Pricing
Looker does not publish pricing publicly. Based on typical sales conversations:
- Standard deployments start around $5,000 to $7,000 per month
- Larger orgs with more users and higher query volumes run $10,000 to $20,000-plus per month
- Implementation and consulting fees are common
Looker pricing targets enterprises where governance and embedded analytics justify the investment, not small or mid-market companies.
The Hidden Costs
Both platforms carry costs beyond the subscription fee - our best BI tools 2026 roundup breaks down total cost of ownership across the leading platforms.
Power BI hidden costs: Premium Capacity for embedded analytics ($4,995/mo minimum) surprises organizations planning for Pro pricing; gateway infrastructure and DAX training add real cost.
Looker hidden costs: LookML implementation requires data engineering or consulting; ongoing model maintenance demands technical resources smaller organizations often lack.
Scalability and Performance
Power BI scales fastest for moderate datasets through its in-memory import model, while Looker scales further on large datasets by pushing every query down to the underlying warehouse such as BigQuery or Snowflake. Each approach trades a different axis of performance.
Power BI at Scale
Power BI’s import model loads data into an in-memory columnar engine for very fast queries on datasets that fit the model, but creates refresh latency - users see data as of the last refresh, not real-time. DirectQuery mode fixes freshness but can create performance issues on large, complex queries; Premium capacity and the large-dataset storage format extend the ceiling, though billions of rows still require careful architecture.
Looker at Scale
Looker never stores data - it generates and executes SQL against your underlying database, so scale is determined by the warehouse, not Looker. Organizations running BigQuery, Snowflake, or Databricks can query billions of rows; the ceiling is essentially the warehouse’s ceiling.
The tradeoff is latency: every Looker explore triggers a SQL query, and complex queries against large tables can take several seconds. Looker’s PDT (persistent derived table) feature partially addresses this by pre-computing complex queries on a schedule.
For very large datasets and real-time needs, Looker’s warehouse-native approach scales further. For fast interactive exploration of moderate datasets, Power BI’s import model is faster.
Best Picks by Use Case: Who Should Choose Each Platform
Choose Power BI when the organization runs Microsoft 365 or needs affordable self-service analytics; choose Looker when data governance, embedded analytics, or Google Cloud integration is the strategic priority.
Choose Power BI If:
- You run Microsoft 365. Excel, Teams, SharePoint, Azure, and Dynamics integration is a meaningful productivity multiplier.
- Business users need to self-serve. Drag-and-drop reports, Copilot natural language queries, and Excel-like syntax lower the floor for analysts without data engineering support - see our best AI data visualization tools roundup for lighter alternatives.
- Budget is a real constraint. At $10 to $20 per user per month, Power BI is accessible where five-figure monthly BI spend is not.
- You are migrating from Excel. Power Query and DAX make the transition from spreadsheet chaos to structured BI more gradual; see complementary data analysis tools.
- Your data volumes are moderate. Millions rather than tens of billions of rows fit the import model well.
Choose Looker If:
- Data governance is a strategic priority. LookML’s single source of truth architecture solves cross-department metric inconsistency directly.
- You need embedded analytics. Looker’s embedding documentation shows granular access controls and white-labeling are core capabilities, not an afterthought.
- You have a mature data engineering team. Dedicated data engineers extract full value from LookML; organizations without that capacity will struggle.
- You are on Google Cloud. BigQuery plus Looker is the natural BI layer for Google Cloud-first stacks.
- You operate at enterprise scale. Very large data volumes, complex access control, and high-volume embedded analytics all point toward Looker - often paired with data analytics platforms like Snowflake or Databricks.
Consider Both (or Neither)
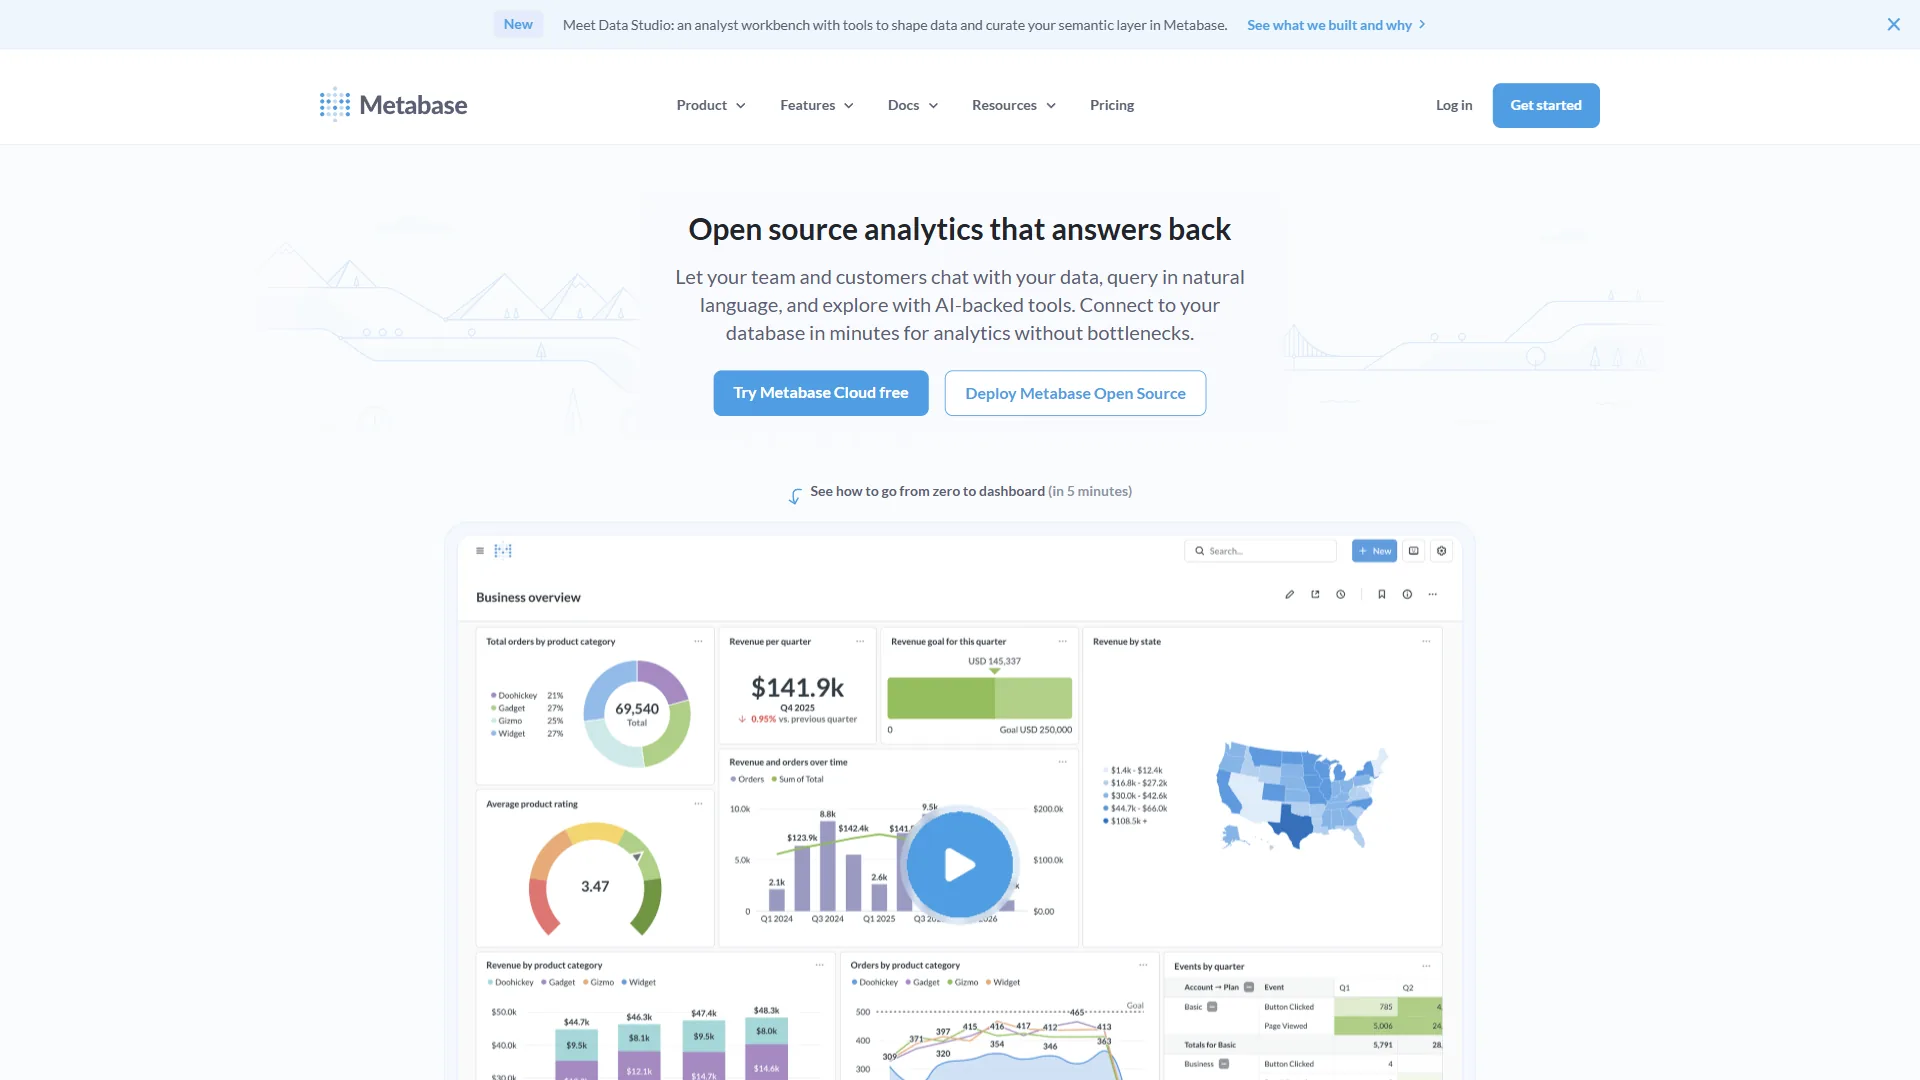
Some organizations run Power BI for internal self-service reporting and use Looker (or an alternative like Metabase) for embedded analytics in customer products. This hybrid adds tool management overhead but makes sense when the use cases do not overlap.
Alternatives like Tableau, Metabase, or Domo are worth evaluating if neither Power BI nor Looker fits cleanly - Tableau offers deeper visualization (see our Looker vs Tableau comparison), Metabase provides open-source SQL-based self-service, and Domo is strong on mobile and executive dashboards.
The Bottom Line
Looker and Power BI serve different markets, so the choice is rarely close once requirements are honest.
Power BI fits the vast majority of organizations - affordable at $10 to $20 per user per month, self-service friendly, Microsoft 365-native, and mature enough for serious analytics without an enterprise-scale data operation.
Looker fits organizations where data governance, LookML semantic modeling, and embedded analytics justify enterprise spend - a dedicated data engineering team, Google Cloud as the warehouse, and a need for a single authoritative source of metric truth across dozens of teams.
If the price gap feels uncomfortable, that discomfort is informative: Power BI’s pricing makes the decision easy for most organizations, while Looker’s pricing assumes the cost of governance failure and metric inconsistency exceeds the subscription.
FAQ
Common questions about Looker vs Power BI focus on pricing, replacements, disadvantages, and platform longevity - the answers follow.
Q: What is better, Looker Studio or Power BI?
Power BI is the better choice for self-service analytics, Microsoft 365 integration, and budgets under $20 per user per month, while Looker Studio (and the paid Looker platform) is the better choice for centralized semantic modeling and Google Cloud-native analytics.
Q: What is replacing Google Looker?
Nothing is replacing Looker - it was acquired by Google in 2020 and remains a core Google Cloud product, built around LookML as its single architectural distinction from every other BI tool.
Q: What are the disadvantages of Looker?
Looker’s main disadvantages are high enterprise pricing - typically $5,000 to $10,000-plus per month with no self-service tier and no free trial - plus deployment requiring dedicated data engineering, limited self-service for business users, and a narrower native visualization library than Power BI.
Q: Is Power BI being phased out?
Power BI is not being phased out. It has been the dominant self-service BI platform globally since 2015, Microsoft continues active development including Copilot natural language queries, and it remains deeply integrated with Excel, SharePoint, Teams, and Azure SQL.
Related Reading
The Looker vs Power BI decision sits inside a wider BI landscape - the resources below extend the comparison to adjacent tools and categories.
Tools covered in this article:
- Power BI - Microsoft’s self-service BI platform
- Databricks - Unified data analytics and AI platform
- Metabase - Open-source BI and analytics
- Tableau - Visual analytics and dashboards
- Domo - Cloud-based BI and data visualization
More BI and analytics guides:
- Domo vs Power BI 2026 - Mobile BI, executive dashboards, and total cost
- AI Tools for Data Analysis 2026 - AI-native analytics that complement or replace traditional BI
- AI Tools for Accountants 2026 - Finance-specific tools that work alongside BI
- Best Business Intelligence Tools 2026
External Resources
External documentation provides the authoritative deep dive on each platform’s modeling language.
- Microsoft Power BI Documentation - Official docs for DAX, Power Query, and Power BI Service
- Google Looker Documentation - Official LookML reference and deployment guides
- dbt Analytics Engineering Guide - Context on the semantic layer trends that inform Looker’s architecture