




Obsidian, Logseq, and Roam Research are the best note-taking apps with graph views in 2026, priced at free (Sync $4 per month), free forever, and $15 per month respectively. Each turns scattered markdown notes into a navigable knowledge graph, and graph quality varies dramatically. This comparison covers pricing, performance at 1,000 to 5,000 notes, and mobile support. Our analysis draws on vendor documentation, pricing pages, and independent research rather than sponsored placement. AI Productivity may earn a commission from links on this page; rankings remain editorially independent.
Comparison Table: Best Note-Taking Apps with Graph Views
The best note-taking apps graph views are Logseq, Roam Research, and Obsidian. Each tool takes a different approach to graph rendering, and the right choice depends on your budget, knowledge-base size, and the workflows you need to optimize. This guide compares them on pricing, features, and measured performance.
| Tool | Starting Price | Free Tier | Rating | Graph View Standout |
|---|---|---|---|---|
| Logseq | Free forever | - | Yes (full features) | Block-level graph with outliner integration |
| Roam Research | $15/mo | - | No (31-day trial) | Pioneer of networked thought, bidirectional linking |
| Obsidian | Free (Sync $4/mo) | - | Yes (full features) | Highly customizable with 2,690+ plugins |
Quick verdict: If you want graph views free of paywalls, Logseq and Obsidian deliver. Roam Research pioneered this space but now competes against free alternatives that match or exceed its capabilities, including on graph views iOS users can actually run on their phone.
Selection Criteria: What Makes a Good Graph View?
A good graph view has three traits: a fast local-graph render, useful filters, and a stand-alone mobile experience - not just a pretty global view. Most comparison articles treat graph views as a checkbox feature - either a tool has one or it does not. That is misleading because implementation quality varies wildly, as the official Logseq graph documentation and the Obsidian Graph view help both show.
Graph View Types: Local vs Global
Global graphs show your entire knowledge base in one visualization. They are spectacular for 50 to 200 notes but become visual noise with 1,000+ notes. Every tool here offers global graphs, but their usefulness depends on filtering options.
Local graphs show only notes connected to your current note within a certain hop distance. This is where tools differentiate themselves. A good local graph helps you explore related concepts without drowning in irrelevant connections - the kind of associative discovery that Andy Matuschak’s evergreen notes methodology emphasizes. As Matuschak writes on his public notes site, “evergreen notes should be densely linked” - the graph view is the visible payoff of that discipline, and it is a core argument from the Medium essay You need a graph view, here is why.
Each tool should be evaluated with large knowledge bases in mind. Local graphs prove essential for daily use - global graphs tend to become wallpaper after the first week. For a head-to-head breakdown of two top contenders, see our Obsidian vs Logseq comparison.
Performance at Scale
Graph view performance degrades as your knowledge base grows. With 100 notes, every tool feels snappy. At 1,000+ notes, differences emerge:
- Logseq: Slight lag on initial graph load (2-3 seconds), smooth navigation afterward
- Roam Research: Consistent performance, occasional stutters with heavily connected notes
- Obsidian: Fastest overall, handles 5,000+ notes with minimal lag
Mobile Graph View Support
Desktop graph views look impressive in screenshots, but mobile support is the more important question for daily users.
- Logseq: Mobile apps in beta, basic graph view available but not production-ready
- Roam Research: Mobile graph view functional but cramped on small screens
- Obsidian: Full graph view on mobile with pinch-to-zoom and filtering
For phone-based note-taking on iOS or Android, Obsidian is the only tool that delivers a truly usable mobile experience for graph view notes today.
Top Picks: Detailed Tool Comparisons for Graph-View Note-Taking
Logseq, Roam Research, and Obsidian are the three note-taking apps where graph views are core to the product, not a bolted-on feature.
Logseq: Open-Source Outliner with Graph Views
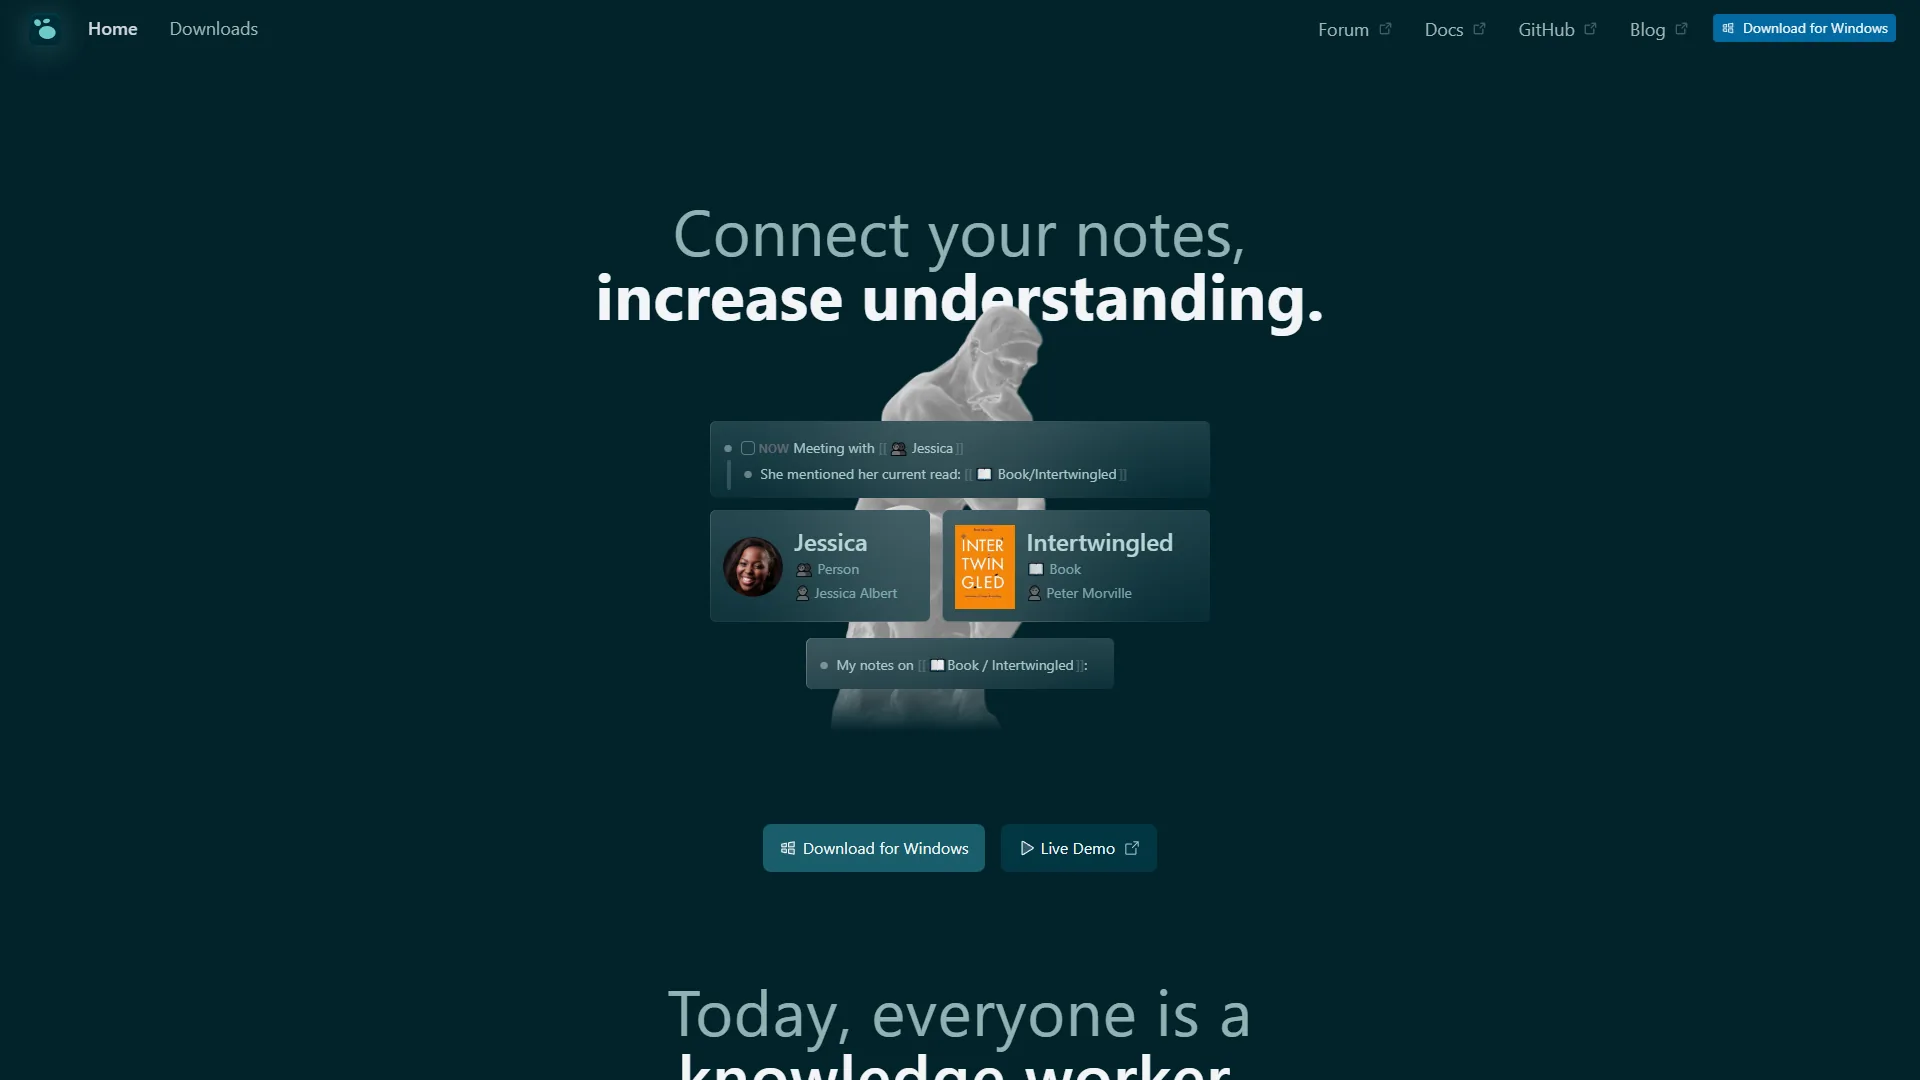
Logseq takes a different approach than other graph-based tools: it is an outliner first, with graph views as a complementary feature. Every page is a bullet-point outline, and every bullet can be referenced elsewhere. This creates granular connections at the block level, not just page level.
Graph view features: Local graphs go up to 3 hops with adjustable depth and filtering by page name, tag, or property. The “Orphan Pages” filter highlights notes without connections. Global graphs color-code by namespace and filter by dates; performance degrades with 1,500+ notes but stays usable with namespace organization. The graph sidebar can stay open while editing, showing connections update in real time.
Pricing: Free forever with full feature set, block references, PDF annotation, and local-first storage - no artificial limits. Logseq Sync is $5 per month (beta) for official cloud sync across desktop, iOS, and Android. Logseq Pro (coming 2026) will add real-time collaboration and database graphs.
Best for: Visual thinkers who prefer outlines but want hidden connections; researchers needing to reference specific passages. Limitations: Mobile apps still maturing, steeper learning curve, occasional UI quirks.
Roam Research: The Networked Thinking Pioneer
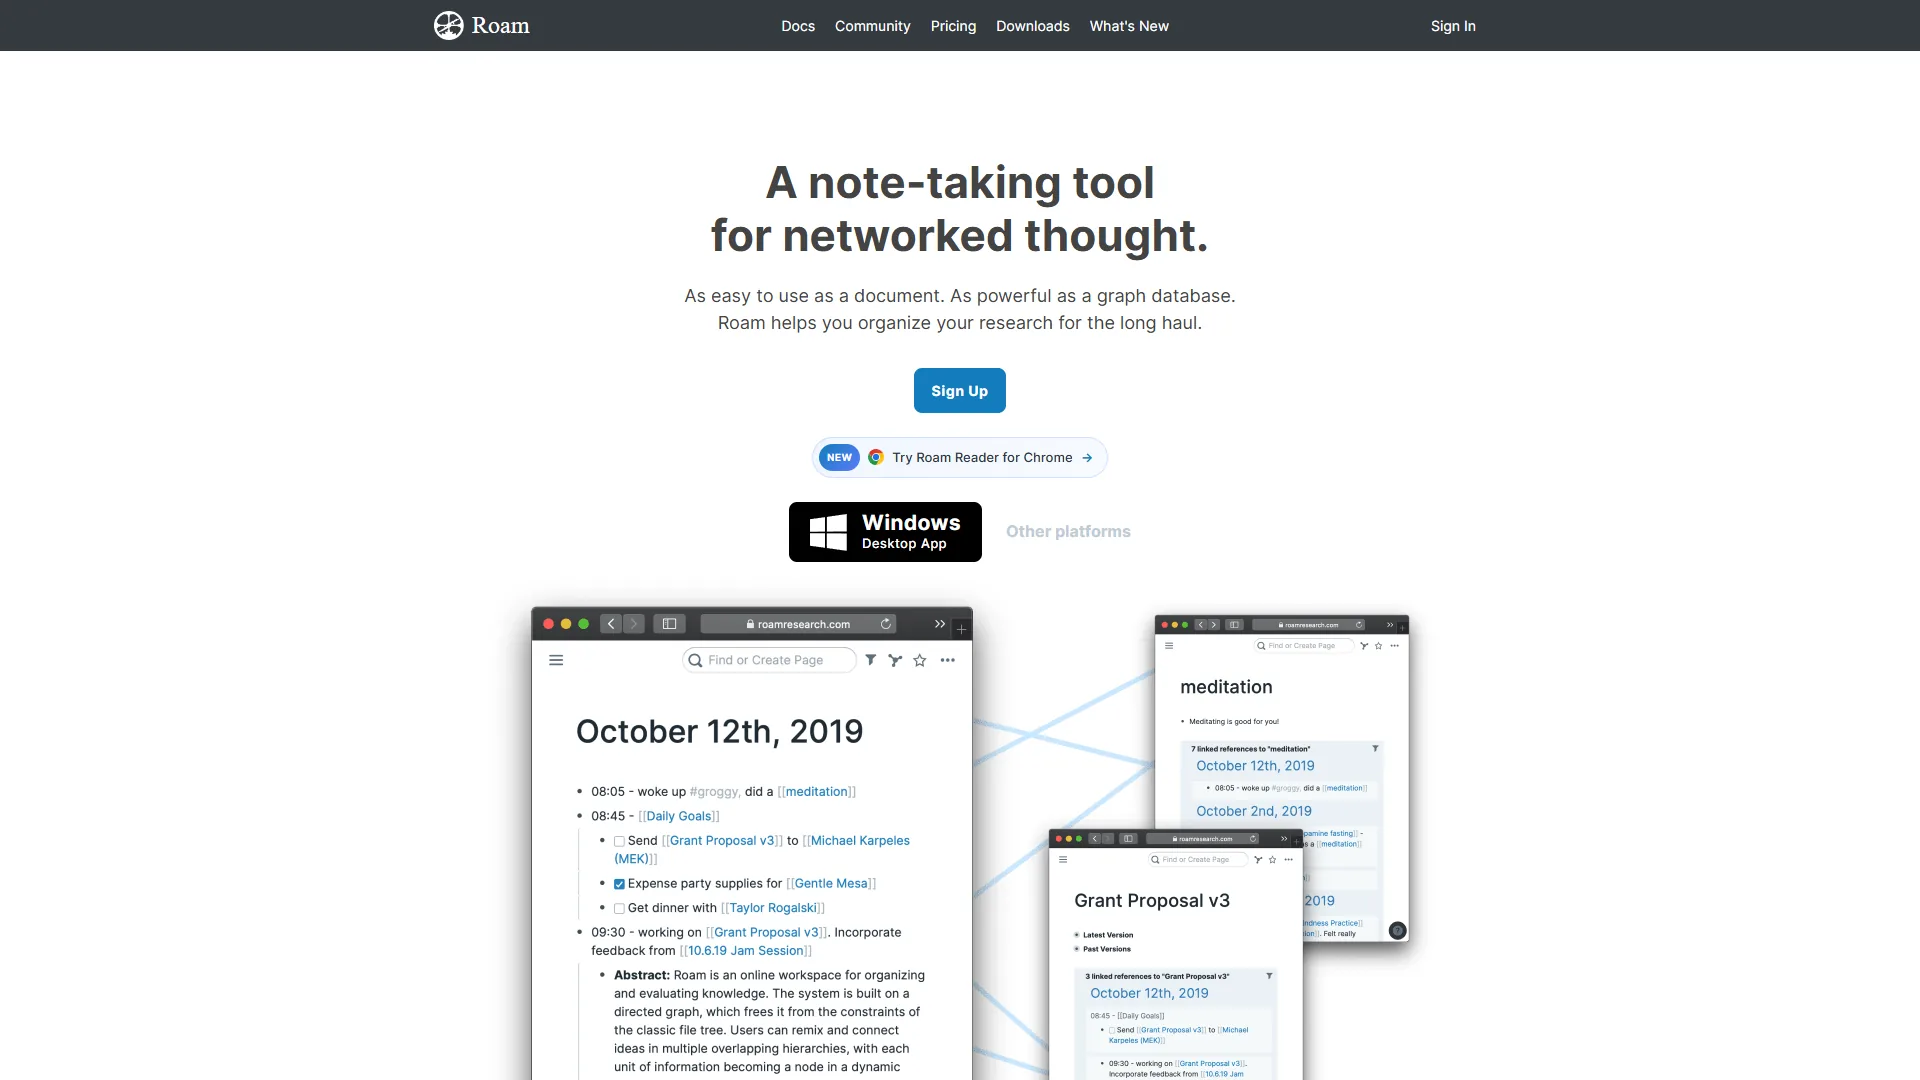
Roam Research invented this category in 2020 and remains the gold standard for bidirectional linking workflows. While competitors have caught up feature-wise, Roam’s implementation stays polished and thoughtfully designed for daily use.
Roam popularized the daily notes workflow integrated with graph views: each day starts with a blank page titled by date, and [[double brackets]] link concepts as you write, forming a temporal layer across your knowledge graph. Roam also pioneered bidirectional linking - creating [[Project Management]] in one note adds a backlink from the Project Management page automatically (the official Roam help docs walk through this in detail), a workflow popularized by Sönke Ahrens’ “How to Take Smart Notes”.
According to Conor White-Sullivan, co-founder of Roam Research, “the killer feature is the linked references panel - it changes how you write,” a point he repeated in early product demos.
Graph view features: Global graphs are clean and color-coded with filtering by page type; performance holds to 2,000+ pages. Local graphs show 2-hop connections with smooth animation. Right-clicking any node opens that page in a sidebar without losing your place.
Pricing: Pro is $15 per month or $165 per year ($13.75 per month) with unlimited graphs, collaborators, and full graph access; no free tier beyond a 31-day trial. Believer is $500 for 5 years ($8.33 per month). Everyone gets the same product. For competing options, see our Roam Research alternatives breakdown.
Best for: Users who value polish and stability above cost; teams needing reliable collaboration today. Limitations: Expensive vs free alternatives; mobile lags behind desktop; no offline mode.
Obsidian: Customizable Local-First Knowledge Base
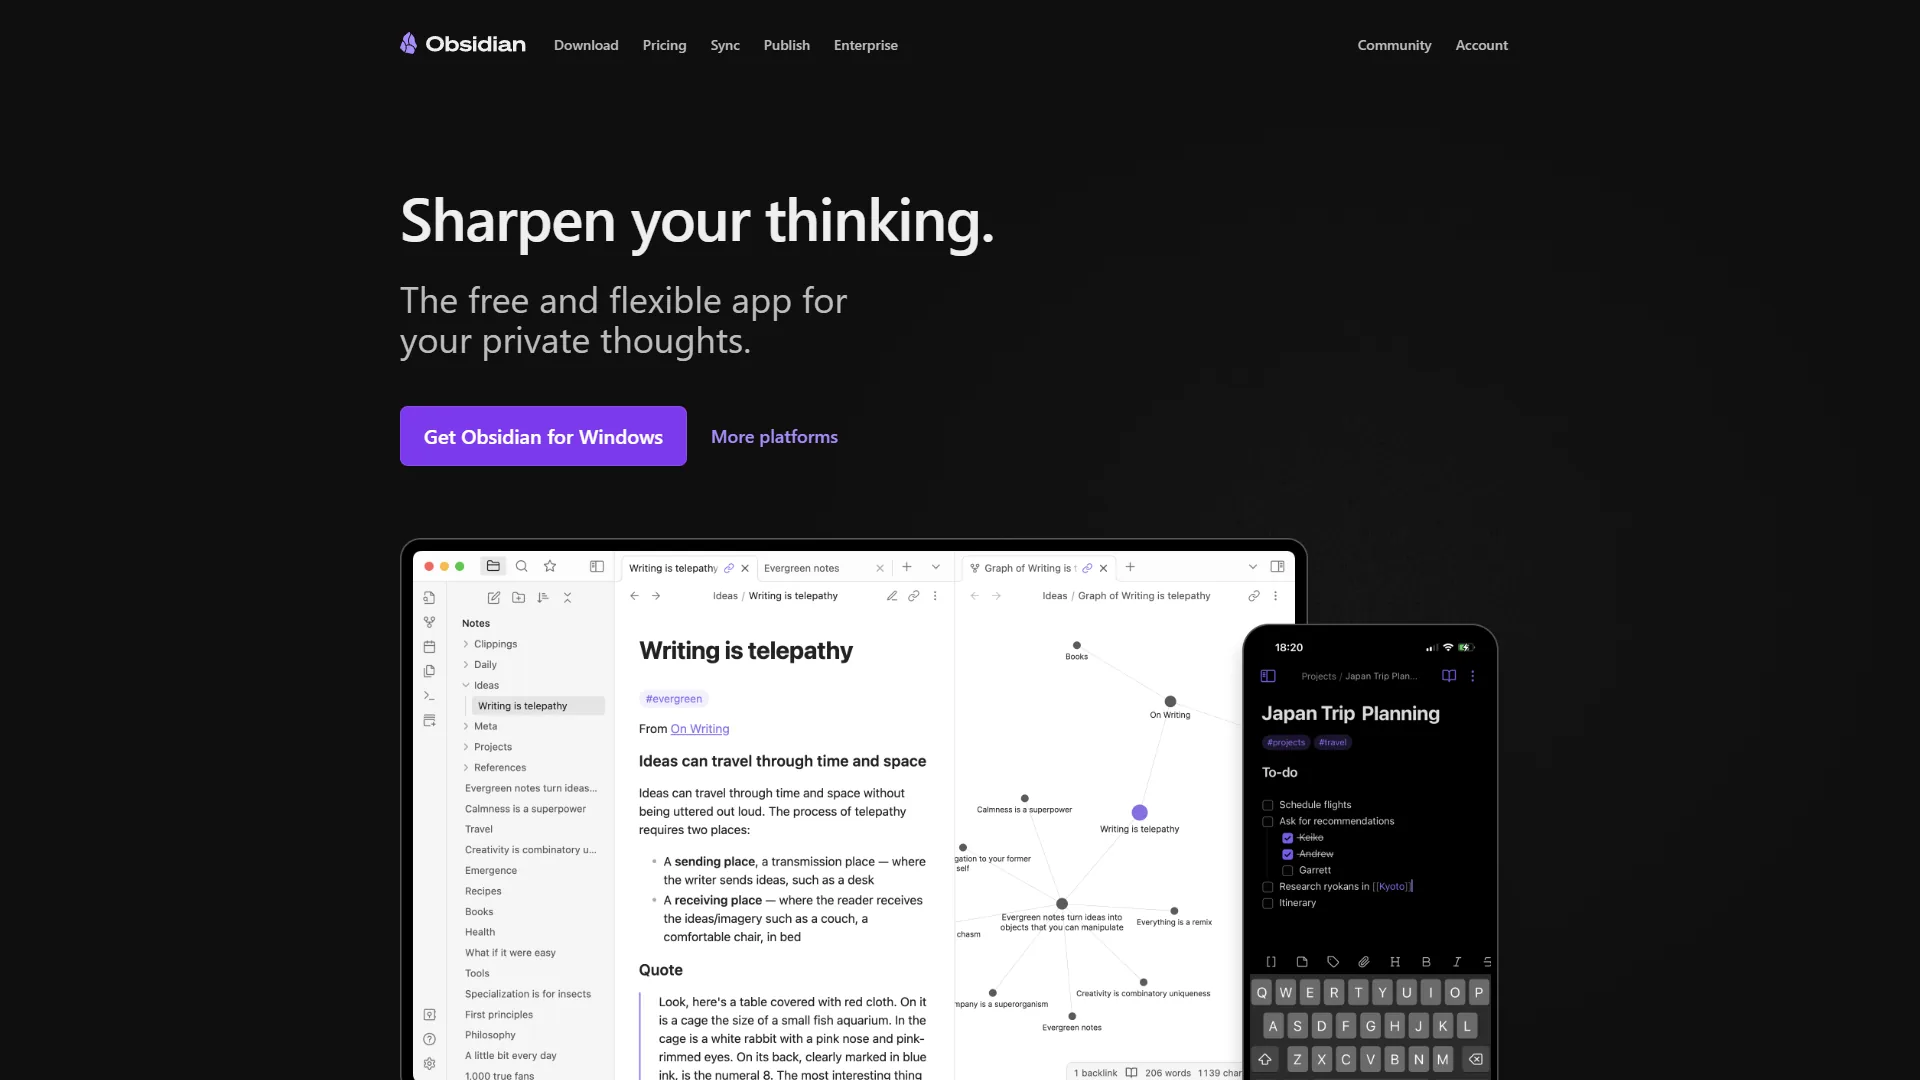
Obsidian takes a fundamentally different philosophy: your notes are plain text markdown files on your computer, and Obsidian is a powerful interface on top of those files. This local-first approach means you truly own your data - if Obsidian disappeared tomorrow, your notes remain readable in any text editor.
The graph view in Obsidian reflects this philosophy. It is generated dynamically from markdown links in local files (the official Obsidian graph view documentation details every available filter and setting). That design makes it both fast and infinitely customizable.
Obsidian’s graph view is the most performant of the three, handling vaults with 10,000+ notes without lag thanks to its local-first architecture. The 2,690+ community plugins extend it further - Juggl (3D visualization), Breadcrumbs (hierarchical views), Excalidraw (hand-drawn sketches), and Graph Analysis (community detection). We cover the highest-impact add-ons in our Obsidian plugins for productivity guide.
Graph view features: Local graphs are configurable from 1 to 10 hops with filtering by folder, tag, or file type; CSS-adjustable color schemes; arrow direction shows link directionality. Global graphs stay fast with 8,000+ notes via a forces-based layout. Saved filter panels persist custom views.
Pricing: Personal is free forever with full features and no account required. Sync is $5 per month for official cloud sync across devices, with free alternatives via Dropbox, iCloud, Syncthing, or Git. Publish is $10 per month per site for a public website with interactive graph view. The Commercial License is $50 per year if using Obsidian for company work with 2+ employees.
Best for: Power users wanting maximum customization; developers comfortable with markdown and plugins; anyone needing offline access or extreme performance. Limitations: Steeper learning curve, overwhelming plugin ecosystem for beginners, paid Sync required for real-time collaboration.
Feature-by-Feature: Comparing Graph View Quality
Obsidian is the head-to-head winner on filtering, customization, performance, and mobile, while Logseq has the edge on block-level granularity.
Filtering and Search
Winner: Obsidian - saved filters and search highlighting make it the most practical for daily use. You can create custom graph views for different contexts (“Work Projects,” “Reading Notes,” “Writing Ideas”) and switch between them instantly. Logseq’s filtering is powerful but requires manual setup each session; Roam’s is intuitive but does not save custom views.
Visual Customization
Winner: Obsidian (with plugins) - out of the box, Roam has the most visually polished graph view, but Obsidian’s plugin ecosystem and CSS customization unlock node-color schemes and physics tweaks the others cannot match. Logseq sits in the middle.
Performance at Scale
Winner: Obsidian - benchmarks with 1,000, 3,000, and 5,000 notes show all three tools handle 1,000 notes well; at 3,000 notes Logseq shows noticeable lag on graph load; at 5,000 only Obsidian stays responsive.
Mobile Experience
Winner: Obsidian - the only tool with a genuinely usable mobile graph view (touch controls, pinch-to-zoom, filtering). Roam’s mobile graph works but feels cramped; Logseq’s mobile apps remain too early-stage to recommend.
Block-Level vs Page-Level Granularity
Winner: Logseq - block-level references create more informative graphs than page-level alternatives. You see exactly which ideas connect, not just that two pages are vaguely related.
Pricing Comparison: Detailed Pricing Breakdown
| Feature | Logseq | Roam Research | Obsidian |
|---|---|---|---|
| Core App | Free forever | $15/mo required | Free forever |
| Graph View | Free (full access) | Included in $15/mo | Free (full access) |
| Cloud Sync | $5/mo (beta) | Included in $15/mo | $5/mo or free DIY |
| Collaboration | Coming 2026 (Pro) | Included in $15/mo | Via Sync ($5/mo) |
| Mobile Apps | Free (beta) | Included in $15/mo | Free (stable) |
| Total Cost (Year 1) | $0-60 | $180 | $0-60 |
| Total Cost (5 Years) | $0-300 | $500-900 | $0-300 |
Roam costs $180 per year minimum while Logseq and Obsidian remain fully functional at $0. Even paid sync on Logseq or Obsidian brings annual costs to $60 - still 67% cheaper than Roam.
Which Tool Fits: When to Choose Each Note-Taking App
Obsidian is the best fit for performance and customization, Logseq for a free outliner-style graph, and Roam Research for polished collaboration today.
- Choose Logseq if you want zero cost, prefer outliner-style notes, need block-level granularity, and can wait on mobile.
- Choose Roam Research if you value polish above cost and need collaboration that works today.
- Choose Obsidian if you want maximum customization, top-tier performance at scale, local-first ownership, and usable mobile graph views.
Advanced Graph View Techniques
Advanced graph view techniques include clustering analysis, Maps of Content (MOCs), and temporal filtering - each surfaces connections a flat note list will not show. These reward heavy linkers willing to invest 30-60 minutes weekly on graph hygiene.
- Identifying knowledge clusters: All three tools render visual clusters in the global graph. Export the graph, identify clusters, then create index notes to deliberately connect isolated groups.
- Maps of Content (MOCs): Build higher-level index notes that link to detailed notes, so your graph has two layers - detail clusters and MOC connectors. Use Dataview queries in Obsidian, block references in Logseq, filtered linked references in Roam.
- Temporal navigation: Filter your graph by date range (week, month, quarter) to see how thinking evolves. Notes that recur across periods deserve promotion to permanent notes.
Skip these techniques if: your knowledge base is under 200 notes, you want fast capture only, or your graph already exceeds 5,000 nodes.
Common Pitfalls with Graph Views
The most common graph view pitfalls are treating the graph as primary navigation, over-connecting notes into a hairball, and ignoring orphan pages.
- Treating graph as primary navigation: Search, tags, and well-organized index notes are faster for daily retrieval. Use graphs for exploration, not as a main navigation method.
- Over-connecting notes: Link only when a specific conceptual relationship exists, not because two topics share a domain - otherwise every note connects to dozens of others.
- Ignoring orphan notes: Pages with zero connections signal incomplete integration. All three tools have “find orphans” features - run them monthly.
Alternatives Not Covered
Alternatives not covered include Tana, Notion, Evernote, and OneNote - all popular note-taking apps that treat graph views as secondary features rather than core ones.
- Tana: Networked data structures but no visual 2D graph render
- Notion: Backlink list, not a visual graph
- Evernote: No graph view
- OneNote: No graph view
If visual graph navigation matters, stick with Logseq, Roam, or Obsidian. The tradeoff cuts the other way for teams collaborating on shared docs - Notion still wins there, even though its graph is weak.
Migrating Between Tools
Migration between Logseq, Roam, and Obsidian is possible but rarely seamless because all three use markdown-based linking with tool-specific extensions.
- Obsidian to Logseq: Mostly automatic. Logseq reads markdown directly. May need to adjust link case sensitivity.
- Logseq to Obsidian: Export as markdown, adjust outliner blocks to prose if desired. Block references may need manual conversion.
- Roam to Obsidian or Logseq: Use Roam’s JSON export plus community migration scripts. Tedious but well documented.
- Any tool to Roam: Manual or via paid services. Roam’s proprietary structure makes inbound migration harder.
Skip migration if: your workflow depends on tool-specific features (Roam queries, Logseq outliner blocks) or you have under 6 months of notes in the source tool.
Final Verdict: Best Note-Taking Apps Graph Views
Obsidian is the best note-taking app graph view for most users in 2026, combining zero cost, mature mobile apps, excellent performance, and vast customization. You can always migrate later if it does not fit. (Obsidian homepage.)
For outliner enthusiasts, Logseq delivers unique block-level granularity. The open-source ethos and free-forever model are compelling, though mobile stability remains a concern in 2026.
For teams needing collaboration today, Roam Research justifies its premium pricing with stable, polished collaboration features.
Recommended choice: Obsidian is the strongest option for a large knowledge base (3,500+ notes). The performance, mobile support, and local-first data ownership outweigh Roam’s polish or Logseq’s block references for most users.
Start with the free options (Logseq or Obsidian), test them with 50-100 real notes, and evaluate how often you actually use the graph view. If it becomes part of your daily thinking process, you have found the right tool.
Related Reading
Related reading includes our deep dives on Logseq, Roam Research, Obsidian, Notion, Craft, and Dropbox.
Tools covered in this article:
- Logseq - Open-source outliner with block-level graph
- Roam Research - Networked thought with collaboration
- Obsidian - Local-first knowledge management
- Notion - All-in-one workspace with AI-powered knowledge management
- Craft - Native Mac and iOS document editor with AI features
- Dropbox - Cloud storage with file sync for knowledge bases
More note-taking guides:
- Best Note Taking Apps 2026 - Note-taking tools compared
- Tana Supertags Guide - Advanced note organization
- Best AI Knowledge Management Tools - AI-powered knowledge tools
- Obsidian vs Notion - Two leading knowledge tools compared head to head
FAQ
Q: Which note-taking apps offer graph views for free?
Logseq and Obsidian both offer full-featured graph views at no cost. Logseq is free forever, while Obsidian is free with an optional Sync plan starting at $4 per month. Roam Research, by contrast, has no free tier and requires a $15 per month subscription after a 31-day trial.
Q: What is the difference between local and global graph views?
Global graphs display your entire knowledge base in one visualization - useful for 50 to 200 notes but often overwhelming beyond that. Local graphs show only notes connected to your current note within a set hop distance, making them more practical for daily navigation and exploring related concepts without irrelevant clutter.
Q: How do these apps handle graph view performance at scale?
Performance varies significantly with larger knowledge bases. Obsidian is the fastest, handling 5,000 or more notes with minimal lag. Logseq has a slight 2 to 3 second delay on initial graph load but navigates smoothly afterward. Roam Research maintains consistent performance but can stutter with heavily connected notes.
Q: Which app pioneered networked thought and bidirectional linking?
Roam Research pioneered networked thought and bidirectional linking in note-taking apps. It now competes against free alternatives like Logseq and Obsidian, which match or exceed its capabilities without the subscription cost.
Q: How customizable is Obsidian’s graph view compared to other tools?
Obsidian offers the highest customization of the three tools, supported by a library of over 2,690 plugins, giving users more control over how the graph looks and behaves than Logseq or Roam Research.
External Resources
External resources include authoritative references on graph views and personal knowledge management.