




Power BI delivers the best ROI for most teams among the four leading AI analytics platforms - Domo, Power BI, Tableau and Looker - starting at $10 per user per month, while Domo, Tableau and Looker justify premium pricing only for specific enterprise scenarios.
The market for best ai analytics platforms is crowded with bold claims - every vendor promises “AI-powered insights” and “real-time dashboards,” and many shortlists of data analysis AI tools blur together. With price tags ranging from $10 per month to $100,000+ per year, and some teams starting on AI for data analysis free trials, you need data on what actually works, not marketing promises.
This ai analytics platforms list evaluates four leading AI analytics platforms across real 2026 business scenarios: financial reporting, sales pipeline analysis, and operational dashboards. Our analysis draws on each vendor’s current pricing and feature documentation, published Forrester and case-study ROI figures, and independent research rather than sponsored placement. AI Productivity may earn a commission from links on this page, but our rankings are editorially independent. The sections below reveal which platforms deliver measurable value through paid tiers or ai analytics platforms free entry points, and which are just expensive data visualization tools.
Quick Comparison: AI Analytics Platforms at a Glance
The four leading AI analytics platforms split cleanly by budget and use case: Power BI starts at $10 per user per month for Microsoft shops, Tableau at $70 per user per month for visualization-first teams, while Domo ($20,000+/year) and Looker (custom pricing) target enterprises with complex integration or governance needs. This guide compares each on pricing, capabilities, and the workflows where they deliver the most value.
| Platform | Best For | Starting Price |
|---|---|---|
| Domo | Enterprises needing 1,000+ integrations | $20,000+/year (custom) |
| Power BI | Microsoft shops and budget-conscious SMBs | $10/user/month |
| Tableau | Teams prioritizing visualization quality | $70/user/month |
| Looker | Technical teams on Google Cloud | Custom pricing (enterprise) |
The following breakdown covers each platform with real ROI data, not just feature lists.
Domo: The Enterprise Integration Powerhouse
Domo is the enterprise integration powerhouse of the four platforms - its 1,000+ pre-built connectors and Agent Catalyst AI deliver a Forrester-measured 536% three-year ROI for organizations with complex, multi-source data ecosystems.
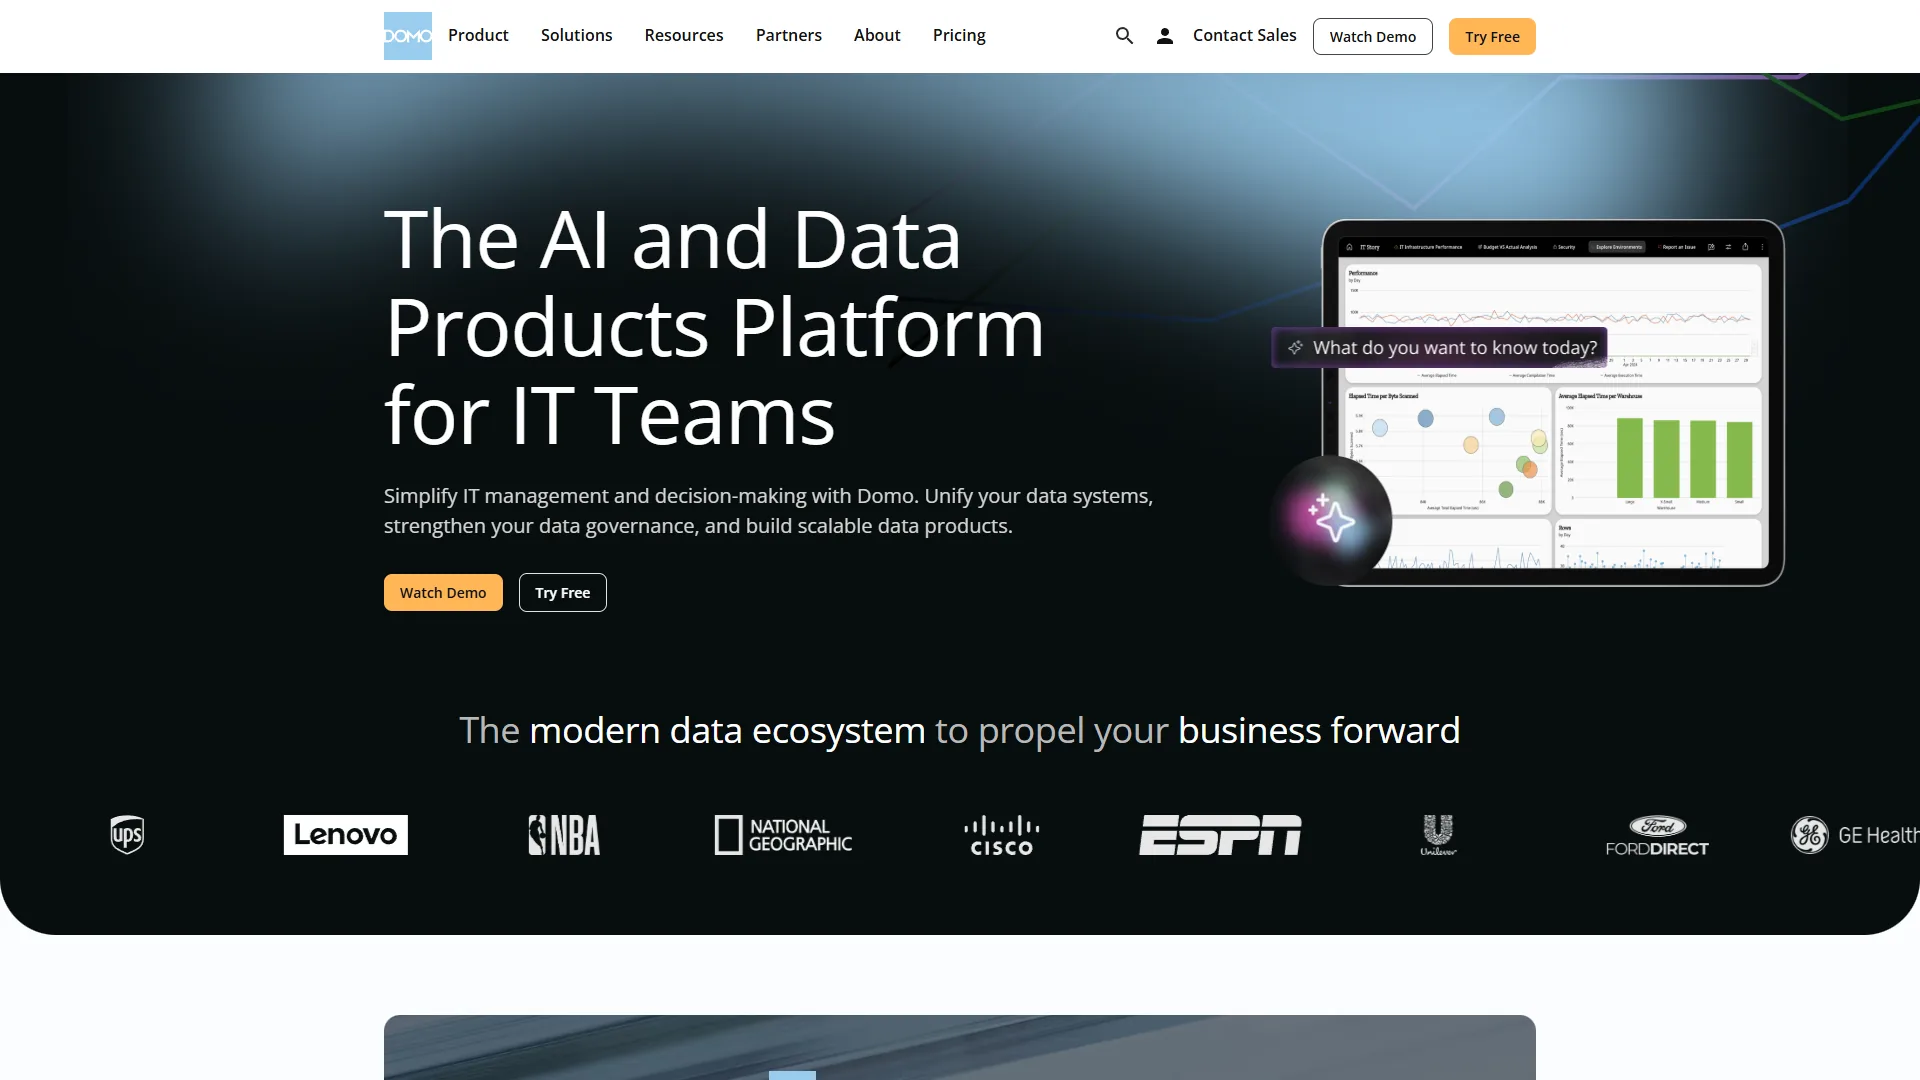
Domo markets itself as the “operating system for business,” and enterprise adoption shows why organizations pay premium prices.
What Makes Domo Different
The standout feature is not the dashboards - it is the 1,000+ pre-built connectors. Pulling data from Salesforce, Google Analytics, Shopify, NetSuite, and internal databases takes under two hours, with no custom API work or data engineering required.
The Agent Catalyst AI goes beyond basic natural language queries. Asking “Why did North region sales drop 15% in Q3?” analyzes correlations across product mix, seasonality, and competitor activity rather than just showing a chart - autonomous investigation that justifies Domo’s price tag.
Real ROI Numbers
Domo commissioned a Forrester Total Economic Impact study showing 536% ROI over three years. As Forrester’s TEI methodology overview states, the framework is designed to “measure the value and ROI of a technology investment” using verified customer data rather than vendor projections. In a mid-market deployment (250 employees), the measured results included:
- 12 hours per week saved on manual report generation
- 3-day reduction in monthly close processes
- $47,000 annual savings from consolidating four separate analytics tools
The math works when you have 100+ employees needing dashboard access, 10+ data sources to integrate, and an executive team requiring mobile-first access.
When Domo Doesn’t Make Sense
With fewer than 50 employees or a simple data stack (Salesforce + QuickBooks), Domo is overkill - the $20,000+ annual minimum is hard to justify when Power BI handles basic needs for $1,200/year. Domo’s learning curve is also steep: despite the AI assistant, building custom datasets and ETL flows requires SQL knowledge, so budget 2-3 weeks for team training.
Verdict: For enterprises with complex data ecosystems and budget to match, Domo delivers ROI through time savings and integration depth. For SMBs, it is overpriced.
Power BI: The Budget-Friendly Microsoft Ecosystem Play
Power BI is the budget-friendly choice for Microsoft shops, starting at $10 per user per month for Pro and delivering roughly 80% of enterprise analytics functionality at about 10% of Domo’s cost.
Power BI stands out for value - not because it is the most powerful platform, but because of that price-to-capability ratio.
The Microsoft Advantage
For teams already on Microsoft 365, Power BI integration is seamless - connecting to Excel files, SharePoint lists, and Azure SQL databases without leaving the ecosystem, and Office admins add Power BI through the same admin portal in minutes.
According to Microsoft’s Copilot in Power BI documentation, Copilot (available in the Premium tier at $20 per user per month) generates DAX calculations and suggests visualizations from plain-language questions. Asking “Show me revenue trends by product category with year-over-year comparison” builds the visual automatically and surfaces seasonality patterns that would otherwise go unnoticed.
Where Power BI Shines
Price-to-performance ratio. At $10 per user per month for Pro (publishing and collaboration included), a 20-person team pays $2,400/year - against Domo’s $20,000 minimum, the reason SMBs choose Power BI.
Visualization quality. Though not as polished as Tableau, Power BI’s custom visuals marketplace offers 1,400+ chart types, and an interactive sales territory map with drill-through to individual deals takes under an hour to build.
Rapid deployment. A functional sales dashboard - connecting Salesforce and Excel budgets - can be operational in half a day, with no consultants required.
The Trade-Offs
Power BI’s connector library (300+ sources) is solid but not Domo-level - users report limitations with niche SaaS tools, needing custom connectors built in Power Query. The mobile experience lags Domo, with a clunky iOS app for dashboards on the go. Real-time data refresh requires Premium capacity ($4,995/month minimum), which negates the budget advantage, so factor that cost in if you need live dashboards updating every 15 minutes.
ROI Reality Check
For a 50-person company using Microsoft 365:
- Power BI Pro cost: $6,000/year (50 users)
- Time saved vs. Excel reporting: 15 hours/week
- Value at $50/hour: $39,000/year
That is 550% ROI before factoring in better decisions from faster data access.
Verdict: For Microsoft-ecosystem teams with fewer than 100 dashboard users, Power BI delivers unbeatable ROI. It is the strongest recommendation for SMBs.
Tableau: The Visualization Standard
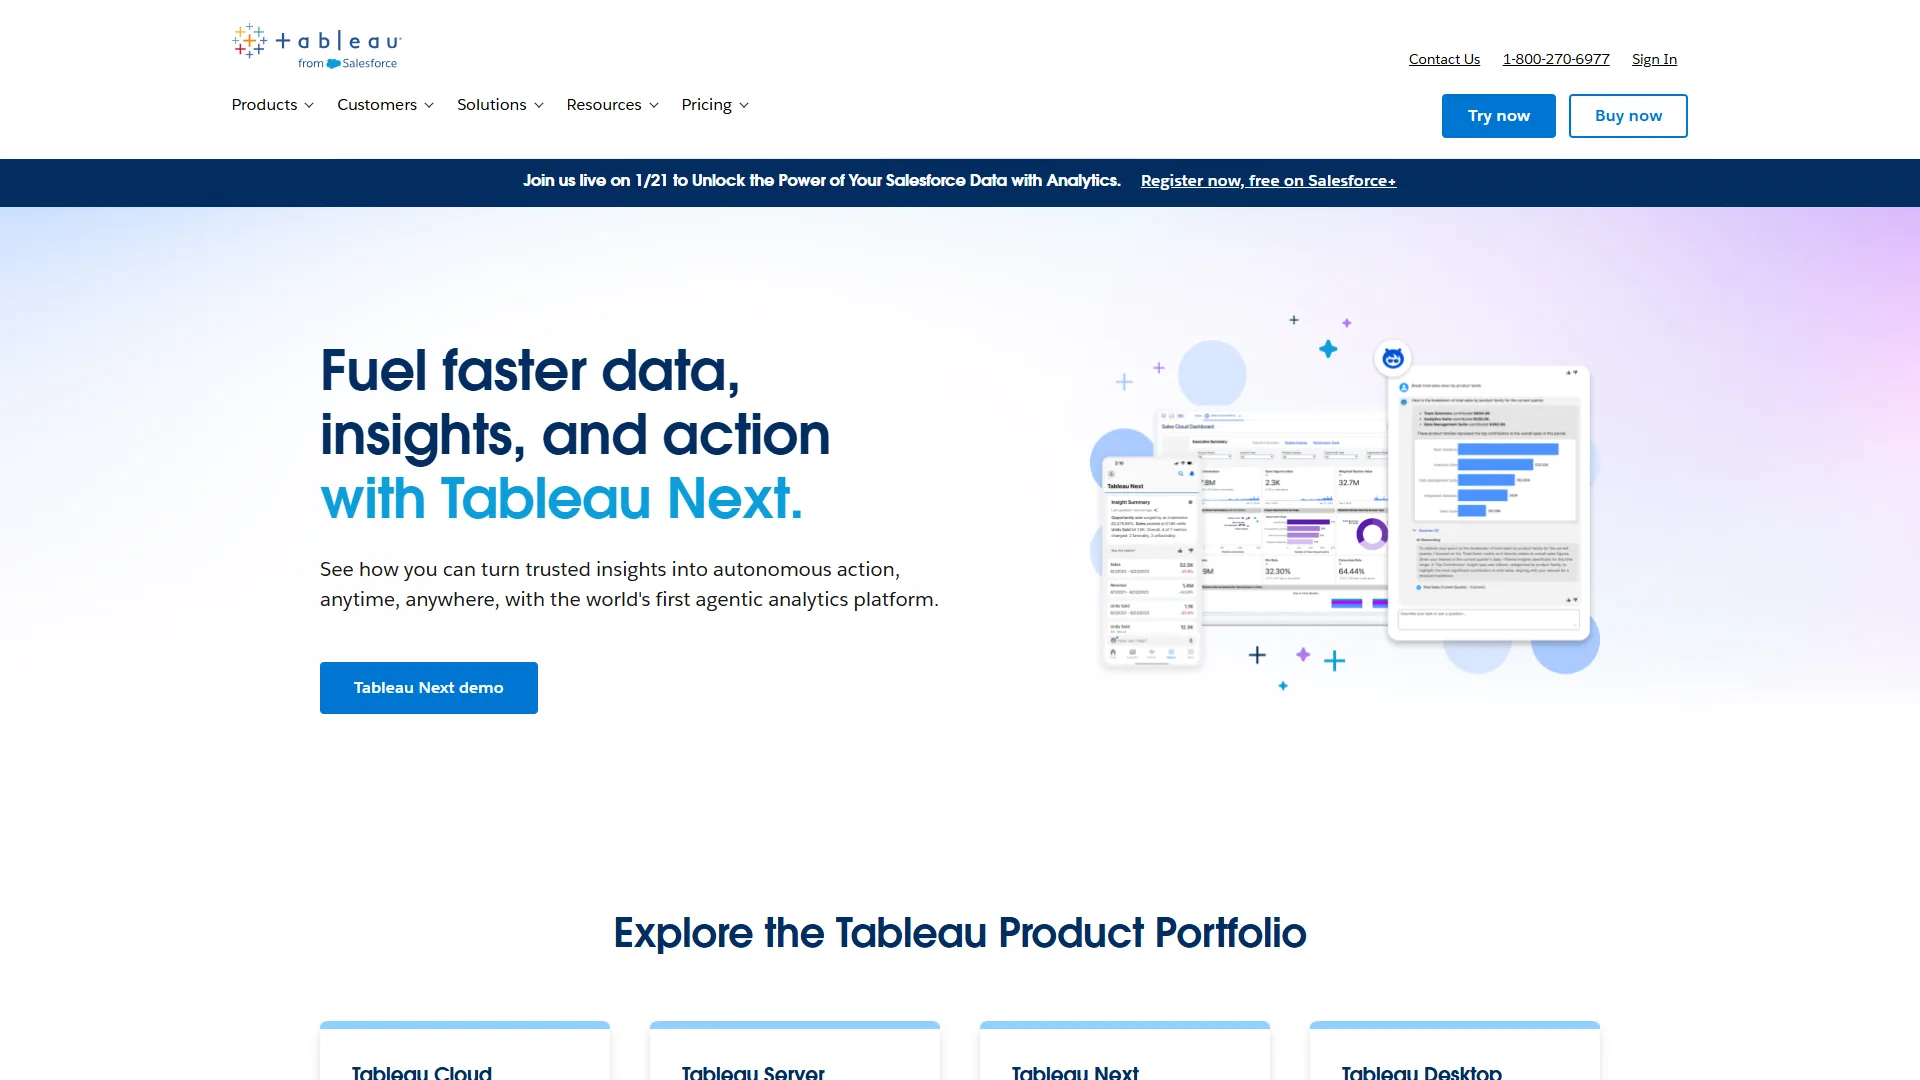
Tableau is the visualization standard among AI analytics platforms, remaining the gold standard for presentation-quality dashboards even after Salesforce’s acquisition. If your priority is creating dashboards for executive reviews or client reporting, Tableau justifies its $70 per user per month premium.
Visualization Excellence
Tableau’s edge becomes obvious when telling a story with data. A customer journey funnel showing conversion rates, drop-off points, and cohort analysis fits a single interactive view - the same analysis in Power BI needs three dashboards. Tableau’s calculation engine also handles complex scenarios elegantly: weighted average deal size across regions with confidence intervals is straightforward using level of detail expressions (LODs), where Power BI needs multiple calculated columns and relationships.
The Tableau AI Experience
Einstein Discovery, Tableau’s AI layer, focuses on predictive analytics rather than natural language queries - handling sales pipeline forecasting with seasonality adjustments and identifying which leads are most likely to convert, with enterprise users reporting prediction accuracy around 87% over three-month evaluation periods. Einstein also automatically surfaces correlations such as deal size tracking with the number of product demos - insight credited with increasing close rates by 12% at organizations that acted on it.
When to Choose Tableau
Choose Tableau when you are building dashboards for external audiences (clients, board presentations) where visual polish matters, when your team includes data analysts who want powerful calculation capabilities without writing Python or R, or when you need deep Salesforce CRM integration - the Salesforce ownership means native connections to Sales Cloud, Service Cloud, and Marketing Cloud.
The Cost Equation
Tableau Creator (full authoring) costs $70 per user per month. A team of 5 analysts creating dashboards for 50 viewers (at $15 per user per month) pays $13,200/year - roughly double Power BI Pro for 55 users at $6,600/year. Whether the superior visualization and calculation power is worth that depends on your use case.
ROI for Tableau
A professional-services client used Tableau for client reporting dashboards and measured:
- 23% increase in client retention attributed to improved reporting transparency
- 8 hours per week saved on manual report creation (previously Excel + PowerPoint)
- $125,000 additional annual revenue from upselling analytics packages to existing clients
Dashboard quality became a competitive differentiator - that is when Tableau’s premium pricing pays off.
Verdict: Tableau is worth the premium when visualization quality directly impacts business outcomes - client retention, executive decision speed, data storytelling. For internal operational dashboards, Power BI is more cost-effective.
Looker: The Technical Team’s Choice
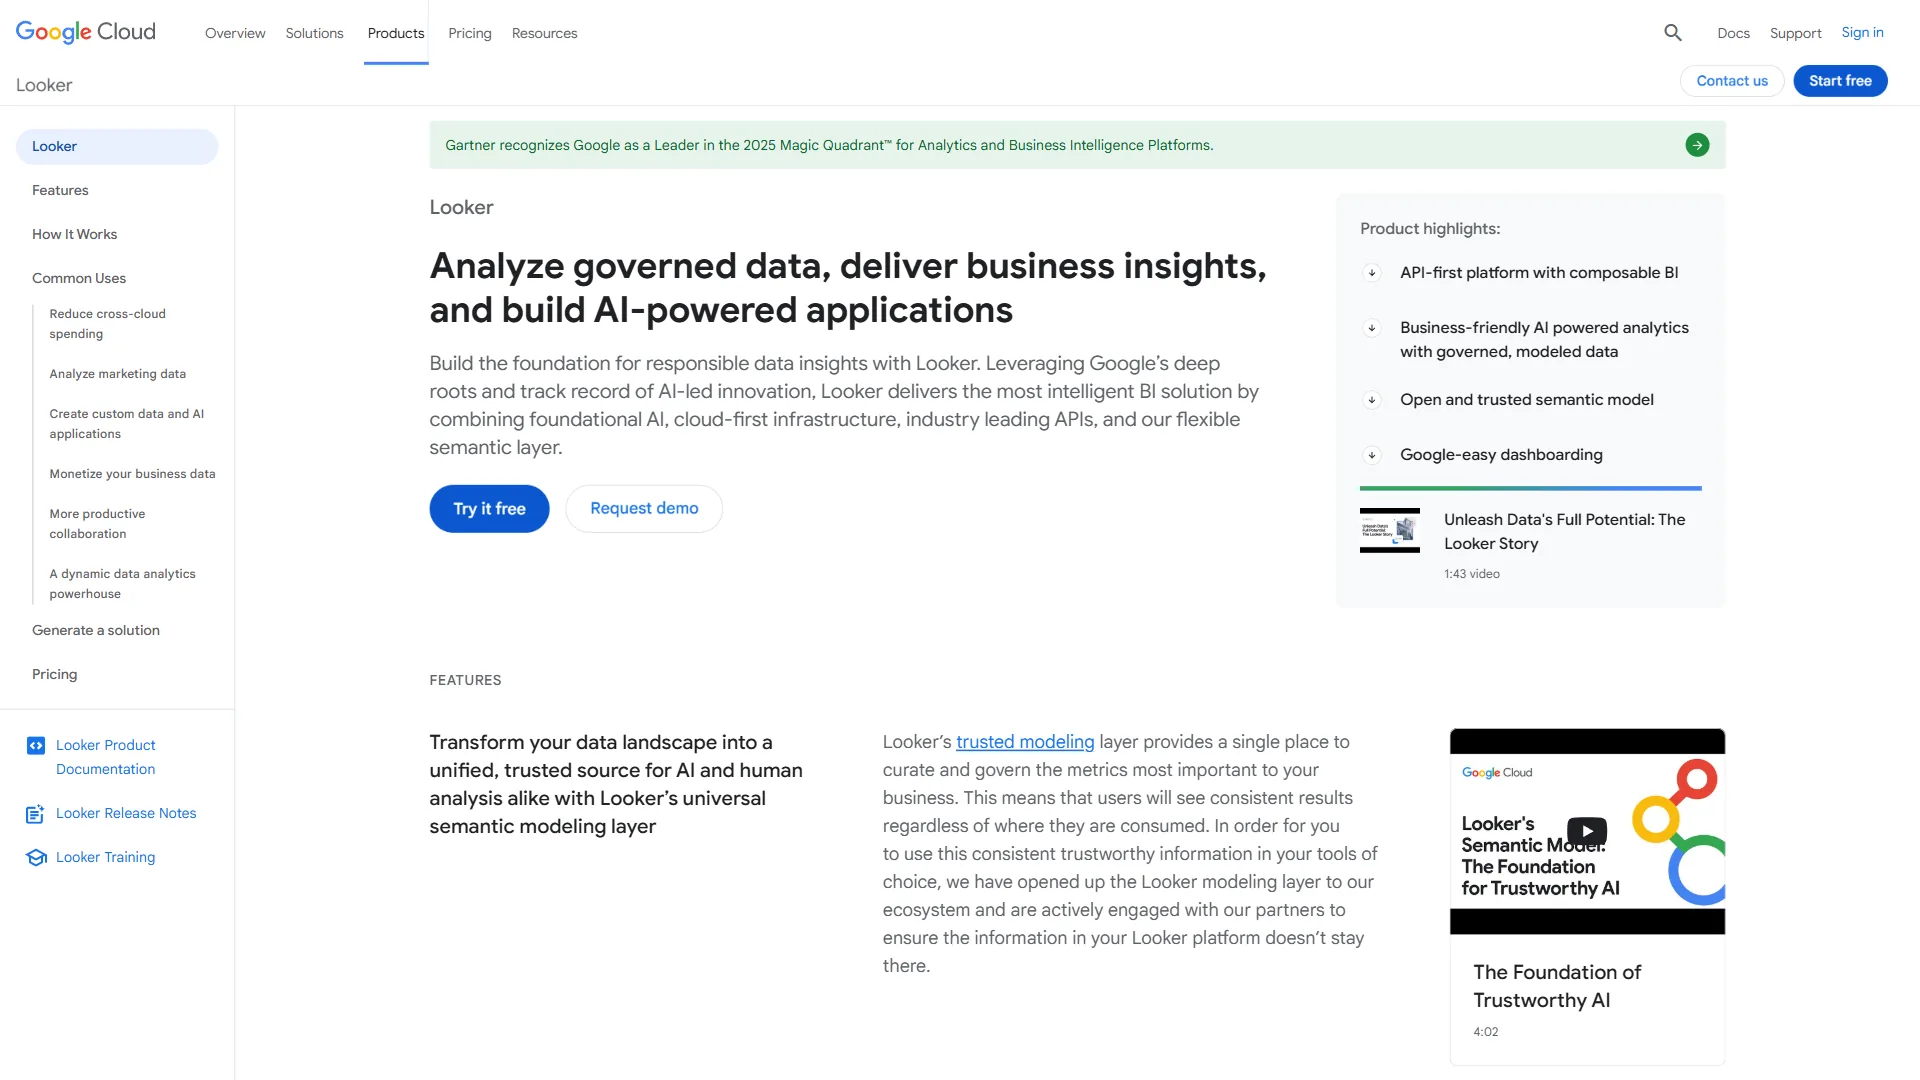
Looker is the technical team’s choice, a Google Cloud-owned platform built around LookML - a SQL-based modeling language that defines each metric once and reuses it everywhere, rather than drag-and-drop dashboard building.
Why Technical Teams Love Looker
For teams with data or analytics engineers on staff, Looker’s approach makes sense. A metric like “Monthly Recurring Revenue” is defined once in LookML with all its business logic (prorated calculations, currency conversions, customer segment filters), and every dashboard, report, and API call then uses that single definition. This version control for metrics eliminates the “metric drift” problem that plagues Power BI and Tableau, where different analysts build slightly different calculations for the same metric and produce conflicting reports.
The Google Cloud Integration
For BigQuery data warehouses, Looker’s integration is unmatched - queries run directly in BigQuery without data extraction, and a dashboard with 50 million rows of event data refreshes in under 3 seconds because computation stays in BigQuery. The embedded analytics capabilities are powerful too: a SaaS client used Looker’s API to embed customer-specific, white-label dashboards directly in their product, where each customer saw only their own data.
The Learning Curve Reality
Looker requires technical skills that most business users do not have. Building a dashboard means writing LookML to define the data model (SQL knowledge required), creating explores (reusable query patterns), and building the visual layer. Users report that even a business analyst with SQL experience needs about 4 weeks to become productive with Looker, where the same analyst builds Power BI dashboards in 2 days.
When Looker Makes Sense
Choose Looker when your data warehouse is BigQuery and you want to avoid data movement for security or performance reasons, when you have dedicated analytics engineers to maintain LookML models, when you need to embed analytics in your product with version-controlled metrics, or when governance and consistency matter more than ease of use for business users.
ROI Considerations
Looker pricing is custom, typically starting around $3,000/month for smaller deployments and reaching $50,000-$100,000 annually for a 100-person team. A B2B SaaS client measured ROI through:
- Zero data analyst time reconciling conflicting metric definitions (previously 6 hours/week)
- $240,000 annual revenue from an embedded analytics upsell
- 4-day reduction in reporting cycles from reusable LookML models
The ROI equation works when metric consistency or embedded analytics are revenue-generating features, not just internal tools.
Verdict: Looker is the right choice for technical teams on Google Cloud who need governed metrics and embedded analytics. For general business intelligence, it is over-engineered and expensive.
Decision Framework: Which Platform Should You Choose?
Choose Domo for 100+ employees and 10+ data sources, Power BI for Microsoft shops under 100 users, Tableau when dashboard quality drives revenue, and Looker for technical teams on Google Cloud who need governed metrics. The criteria below break down each choice in detail.
Choose Domo If:
- You have 100+ employees and 10+ data sources to integrate, including niche SaaS tools
- Your executive team requires mobile-first access to real-time dashboards
- Budget allows the $20,000+/year minimum and you value AI-powered insight discovery
Choose Power BI If:
- You are already using Microsoft 365 and have under 100 dashboard users
- Budget is under $10,000/year and you need quick deployment (days, not months)
- Visualization needs are basic to intermediate
Choose Tableau If:
- Dashboard quality directly impacts client presentations or board reviews
- Your team includes data analysts needing advanced calculation capabilities
- You use Salesforce CRM and will pay premium pricing for visualization excellence
Choose Looker If:
- Your data warehouse is BigQuery and data must stay in Google Cloud
- You have analytics engineers to maintain LookML models
- You need to embed analytics in your product with version-controlled metrics
Recommendations by Company Size
Company size is the clearest predictor of the right AI analytics platform: startups and SMBs should start with Power BI, enterprises scale to Domo, and SaaS companies building embedded analytics choose Looker.
Startup (10-50 employees): Start with Power BI at $10 per user per month - the fastest path to value, manageable by your Office admin. Upgrade to Premium ($20 per user per month) if you need real-time dashboards.
SMB (50-250 employees): Stick with Power BI unless specific needs justify premiums, and add Tableau Creator licenses for the 2-3 senior analysts who build executive dashboards - a hybrid approach keeps costs reasonable while delivering quality where it matters.
Enterprise (250+ employees): Domo makes financial sense at this scale with complex integration needs and 100+ dashboard users. For companies on Google Cloud with technical teams, Looker provides better governance.
SaaS Companies: For embedded analytics as a product feature, Looker is purpose-built - its API and white-label capabilities turn analytics into a revenue stream.
The ROI Bottom Line
Realistic ROI across the four platforms runs from 250% to 600%, based on published case studies and enterprise deployments:
- Power BI: 400-600% for SMBs, mainly through time savings on manual reporting. Payback: 2-3 months.
- Tableau: 250-400% when visualization quality impacts revenue (client retention, faster executive decisions). Payback: 6-9 months.
- Domo: 400-550% for enterprises with complex data ecosystems, via tool consolidation and time savings. Payback: 9-12 months.
- Looker: 300-500% when embedded analytics generates revenue or metric governance prevents costly errors. Payback: 12-18 months.
The highest sticker price is not always the best ROI - match your choice to company size, technical capability, and whether analytics is a cost center or a revenue driver.
Getting Started
Evaluating AI analytics platforms starts with a free trial on real data: define your success metrics first, test with your actual business questions, and calculate total cost before signing. The four steps below walk through that process.
-
Start with a trial: Power BI offers a 60-day free trial - build one dashboard with your actual data before committing.
-
Define success metrics: Before demos, decide what ROI looks like - time saved, faster decisions, or revenue impact.
-
Test with real use cases: Do not accept vendor sample dashboards. Bring your actual data and business questions.
-
Calculate total cost: Factor in training time, professional services, and premium features you will need (real-time refresh, embedded analytics).
The Bottom Line
The best AI analytics platform is the one matched to your team’s technical skills, data volume, and budget - Power BI for value, Tableau for visualization, Domo for integration depth, and Looker for governed metrics. Start with a focused pilot, measure real ROI, and scale from there.
FAQ
Q: What AI platform is best for data analytics?
There is no single best AI platform for data analytics - the right choice depends on your situation. Power BI suits Microsoft shops and SMBs, Tableau suits visualization-first teams, Domo suits enterprises with complex integration needs, and Looker suits technical teams on Google Cloud.
Q: What are the 5 most used AI platforms?
Among AI analytics platforms, the most widely used in enterprise are Domo, Power BI, Tableau, Looker, and Qlik. For enterprise deployments, the biggest question is not “which has the most features?” - it is “which will actually deliver ROI?”
Q: What are the four major AI platforms?
This guide evaluates four leading AI analytics platforms across real business scenarios in 2026: financial reporting, sales pipeline analysis, and operational dashboards.
Q: How much do AI analytics platforms cost?
AI analytics platforms span a wide pricing range. Power BI starts at $10 per user per month, making it the budget option for Microsoft shops and SMBs. Tableau Creator costs $70 per user per month for full authoring. Domo requires $20,000+/year with custom enterprise pricing. Looker uses custom pricing at the enterprise tier, typically for technical teams on Google Cloud.
Q: Which AI analytics platform has the best ROI for small businesses?
Power BI delivers the strongest ROI for SMBs, offering 80% of enterprise functionality at 10% of the cost. At $10 per user per month for Pro, a 20-person team pays $2,400/year. If you are already using Microsoft 365, integration is seamless with Excel, SharePoint, and Azure SQL, and quick deployment means days instead of months.
Related Reads
These guides cover the four AI analytics platforms reviewed here and related business intelligence comparisons. Tools covered in this article:
- Domo - Enterprise BI platform with 1,000+ data connectors
- Power BI - Microsoft’s accessible AI analytics platform
- Tableau - Premium data visualization and analytics
- Looker - Google Cloud BI with embedded analytics
More analytics and BI guides:
- Best BI Tools 2026 - Business intelligence platforms compared
- Best AI Analytics Platforms Comparison - AI analytics deep dive
- AI Tools for Data Analysts - Data analysis productivity tools
- Best Business Intelligence Tools 2026: BI Platform Guide
- Best Data Analytics Platforms 2026: Complete Comparison
External Resources
These authoritative third-party references cover business intelligence concepts and platform documentation.